There are a handful of movies that suck me in whenever they come around. Goodfellas. The Godfather. The Shawshank Redemption.
Still, there’s only one production where I can never get enough of the main character’s outlandishness. Melvin Udall in As Good As It Gets. He hoards bars of soap as part of an obsessive-compulsive disorder. He sneeringly berates a woman for admiring his work as an author. He even shoves the neighbor’s dog down a laundry chute.
The S&P 500’s dividend yield as well as it’s earnings yield (E/P) are near historic lows. That may not have meant as much in 2016 when the risk-free 10-year Treasury note yielded between 1.50% and 1.75%. At the moment, though, the 10-year Treasury is offering 2.56%.
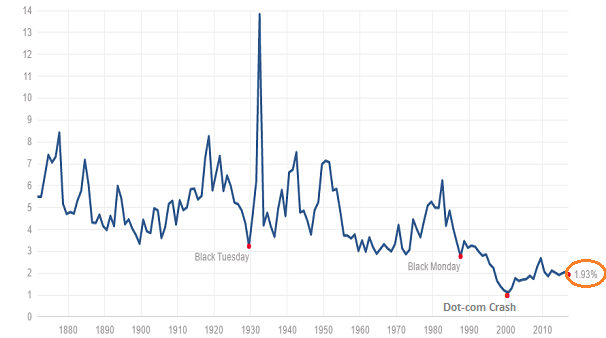
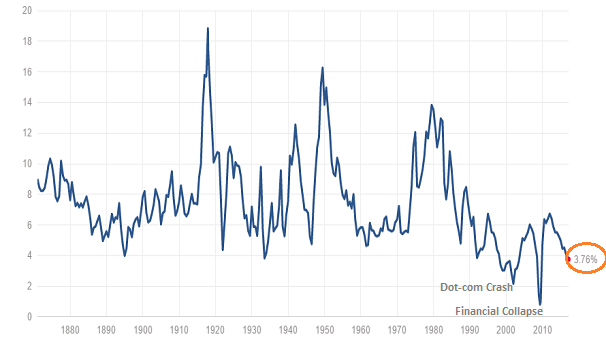
The equity risk premium (ERP) – the excess return for investing in stocks rather than comparable government obligations – is a piddling 1.20% (3.76%-2.56%=1.20%). That is precious little reward for a whole lot of potential risk of financial loss. Worse yet, in nearly 150 years of data, the earnings yield (E/P) was only lower during the tech wreck (2000-2002) and the financial crisis (2008-2009).
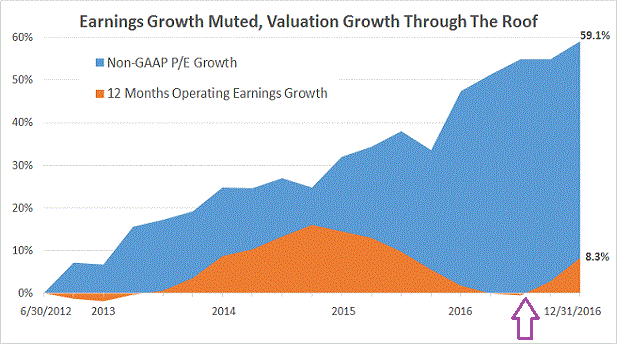
In addition to exceptionally meager dividends, S&P 500 corporations have barely grown bottom line profits since mid-2012. Nearly all of the stock price appreciation over the last four-and-a-half years came with total operating earnings growth of just 8.3%.
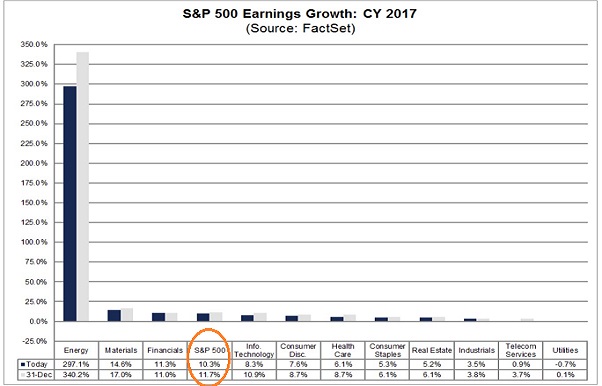
The good news? Earnings growth may be back in style. According to FactSet estimates, we should expect corporations to celebrate double-digit earnings growth (10%-plus) in calendar year 2017.
Anyone who has ever tracked earnings estimates, however, understands that analysts routinely revise estimates lower. How much lower? Over a 12-month period, those original estimates often come down by one-third or more. It follows that we might anticipate annual earnings growth in the neighborhood of 7%.
Even with earnings growth picking back up, current stock prices remain wildly out of touch with their intrinsic value. The S&P 500 has already reached extremes across an array of widely recognized methods of valuation – forward and trailing price-to-earnings (P/E), price-to-sales (P/S), price-to-cash flow (P/OCF), price-to-earnings growth (PEG), market capitalization to GDP, Q Ratio, as well as household percentage ownership of equities to total financial assets.
Doug Short at Advisor Perspectives has taken the time to combine a number of valuation indicators. His findings? Other than during the tech bubble at the start of the 21st century, stocks are more overvalued today than at any other time in history. That includes the precursor to the Great Depression in 1929 as well as the financial catastrophe in 2008.
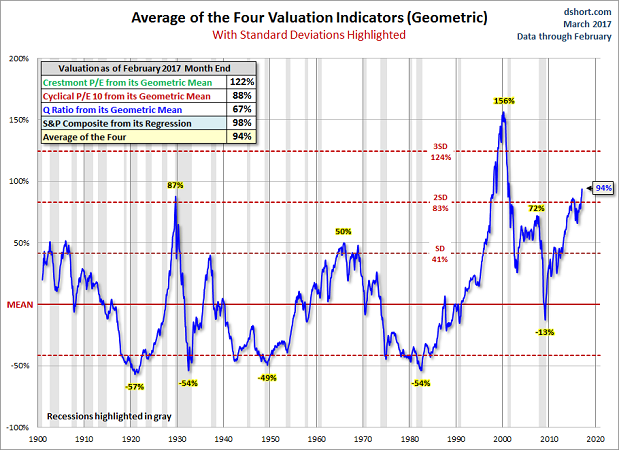
The question then becomes, will 7% earnings growth be enough to justify some of the highest valuation levels in history? Perhaps. You’d probably need to see the inflation rate fall back near 2%, rather than surge forward. You’d probably need to see the 10-year Treasury fall back toward 2%, rather than climb higher. And you’d probably need to see evidence of economic acceleration, rather than the same slow-going stability that has typified the eight-year recovery.
Unfortunately, none of these outcomes appears probable. Consider the erosion of purchasing power (a.k.a. “inflation”) as measured by the Consumer Price Index (CPI). It is running at a much hotter 2.5% than the previous trend below 2%. Equally worrisome, inflation is adversely affecting the real disposable income of consumers.
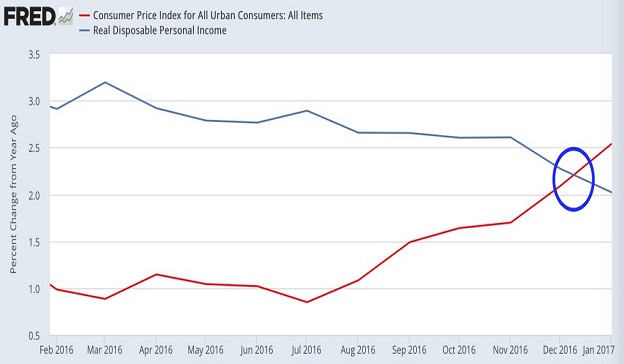
Keep in mind, bonds often compete with equities on relative attractiveness. In an environment that had previously fought off deflationary forces, bonds did not present much of a competitive threat. Now? If inflation continues to heat up? Where future dollars would be worth significantly less? Where bond yields rise to compensate? Many may rethink the extraordinary premium that they currently pay for stock ownership.
Indeed, historical evidence suggests that investor willingness to pay steep P/E valuations diminishes alongside higher readings in the Consumer Price Index. According to research by Strategas Research Partners, since 1950, the higher the Consumer Price Index, the lower the P/E ratio for the S&P 500.
Inflation is not the only threat to further price gains for popular U.S. benchmarks like the S&P 500. The 10-year yield is near a 3-month high as well as a 1-year high. While a 2.56% 10-year may not seem like a huge threat on an absolute basis, a meaningful push above a 3% level would serve as a severe drag on the “cost of money.” Real estate-related borrowing might be downsized dramatically.
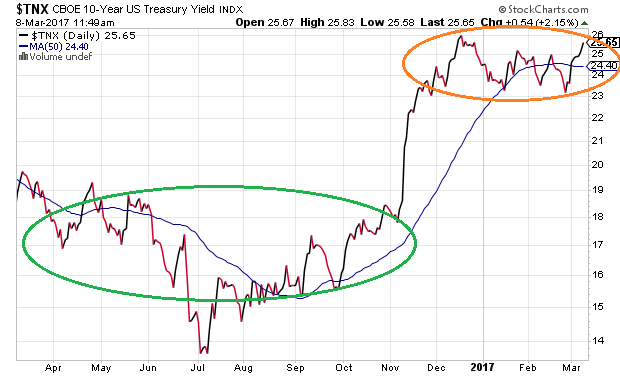
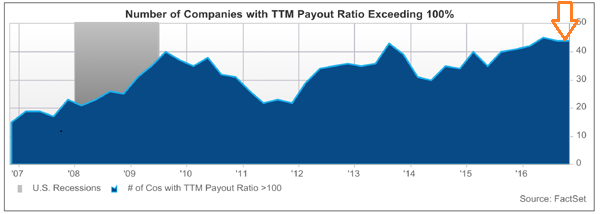
Corporations will still be borrowing at any and all costs. (They will have to when current obligations mature.) That said, companies may be less likely or less capable of funneling those borrowed dollars back into stock buybacks and dividend payouts.
In data going back to 1950 (S&P), the total payout ratio has never surpassed 100% for more than two consecutive years. Dividends and buybacks as a function of earnings already exceeded 100% in 2015 as well as 2016. Meanwhile, the number of companies with payout ratios exceeding 100% is higher than it has been since before the Great Recession, giving rise to the probability of dividend cuts.
The bullish response to rising inflation and higher borrowing costs is that federal government fiscal stimulus will pick up the slack. Somehow, Congress will push through corporate tax-rate reductions, personal tax rate reductions, regulatory reform and infrastructure spending. What’s more, all of these prescriptions will fire up the economic engine in a way that gross domestic product (GDP) will kick into a higher gear.
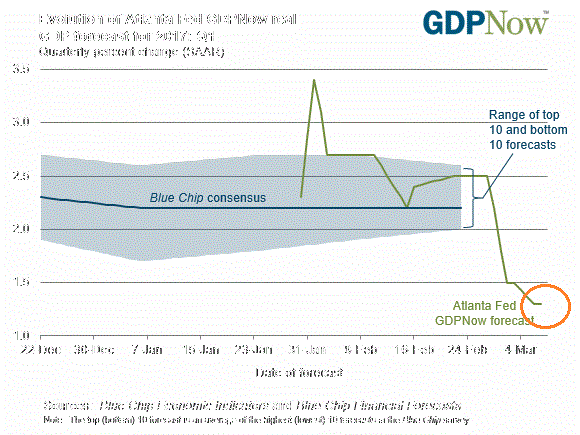
Not if one gives credence to the Atlanta Federal Reserve. The “GDP Now” tool anticipates 1.2% growth in Q1 of 2017. That’s slower than both Q4 2016 (1.9%) and the eight-year recovery average of 1.8%.
Bottom line? The 2400 level for the S&P 500 may or may not be the peak for the current bull market’s run. No individual could possibly know whether or not this is “as good as it gets.” What we do know, however, is that today’s pursuit of upside reward comes with a conspicuous risk of financial loss. I choose to minimize that risk by maintaining a higher-than-normal level of cash in client portfolios.
