
Stocks had a decent start to May 28, testing resistance and the downtrend to start, but that eventually gave way to late day selling. Clearly, the trend, for now, is too strong. On the day, the S&P 500 finished about 85 basis points lower. It wasn’t the trade war grabbing the headlines today, but rate worries and what that means for the economy.
In my view, falling rates means nothing for the economy. We live in a low-interest-rate world, and that isn’t changing. Rates in the US are falling based on supply and demand, have you look at German rates lately? Or Japanese rates? The German Bunds trades at -16 basis points. It really is common sense! Who Bonds would you rather own a US 10-year at 2.3% or a German Bund at -0.16%. Do I have to answer?
Falling rates may have something to do with slowing growth somewhere in the world –mostly Europe. But then again, Europe hasn’t grown for years. But this is the one chart you need to follow the most closely the US 10-Year minus the German 10-Year. We can see that the spread is still incredibly wide, and is on the verge of breaking down significantly, which means that US rates will begin to fall at a faster pace then German bunds.
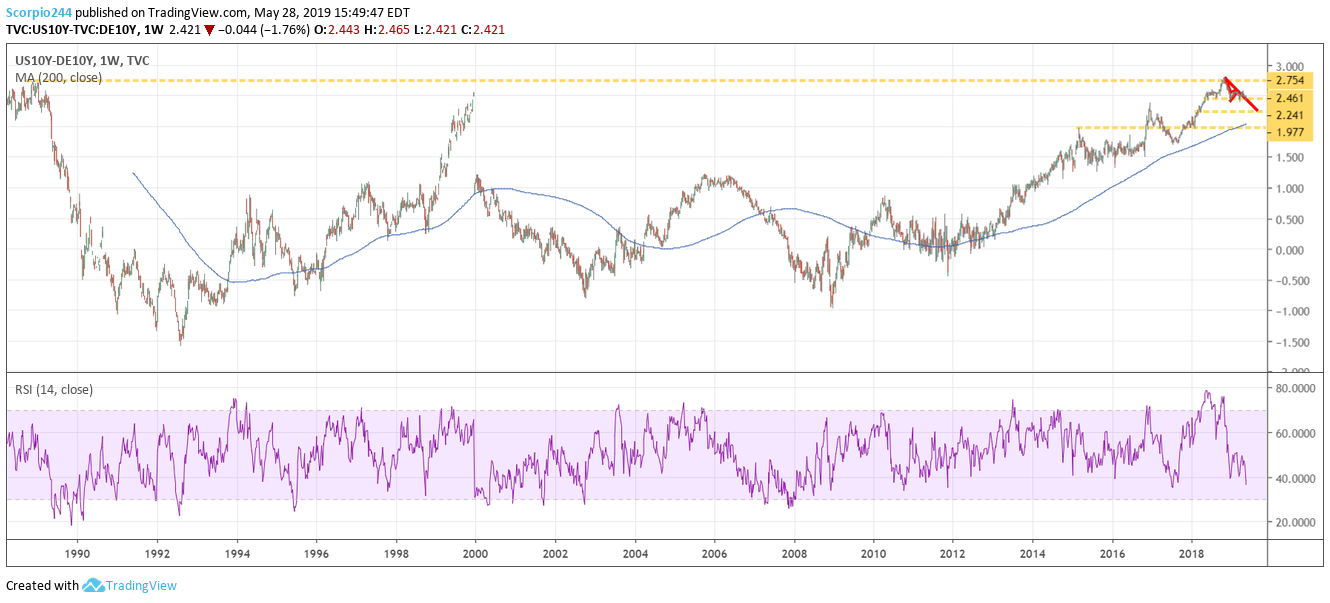
So if you think rates are low, wait they are likely heading even lower. I said this once; I will say it again –to 2%. It is not, a sign of a US recession; it is an issue of global supply and demand for bonds, and the lack of inflation.
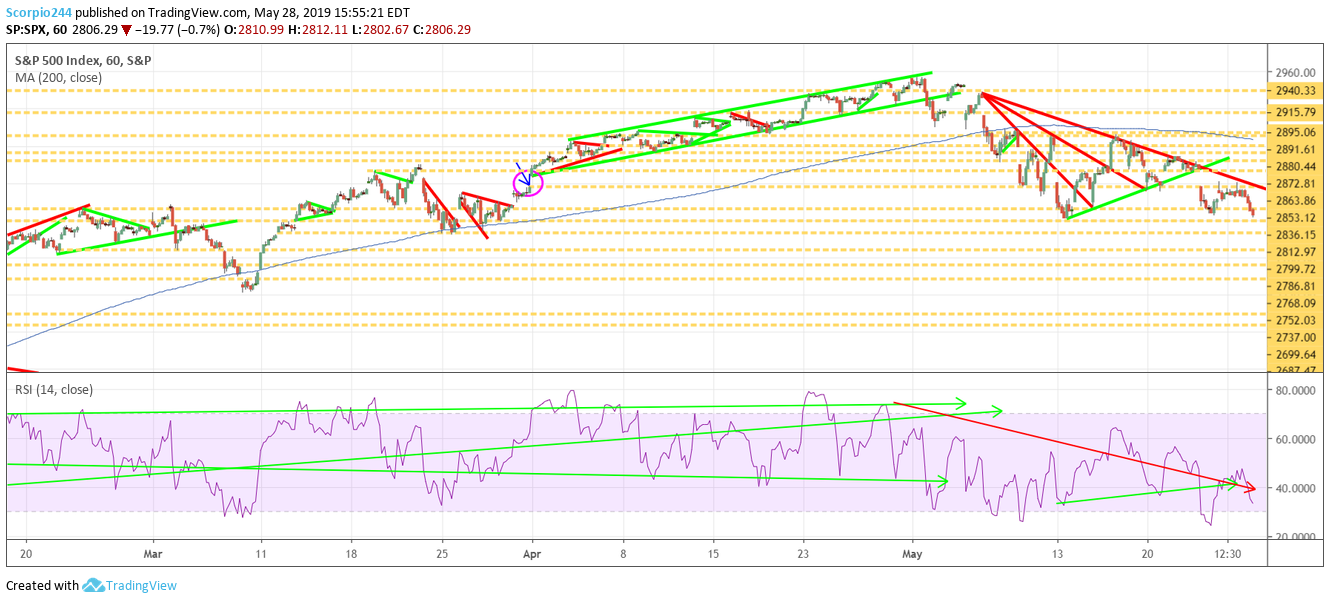
S&P 500
The S&P 500 has been unable to rise above 2,836 the past two trading session and is now breaking down and must hold above 2,800. A drop below triggers the next leg lower to 2,785 and potentially 2,735.
Nasdaq (IXIC)
The NASDAQ is clinging for life at 7,600, and a drop below here sets up a decline to 7,430.
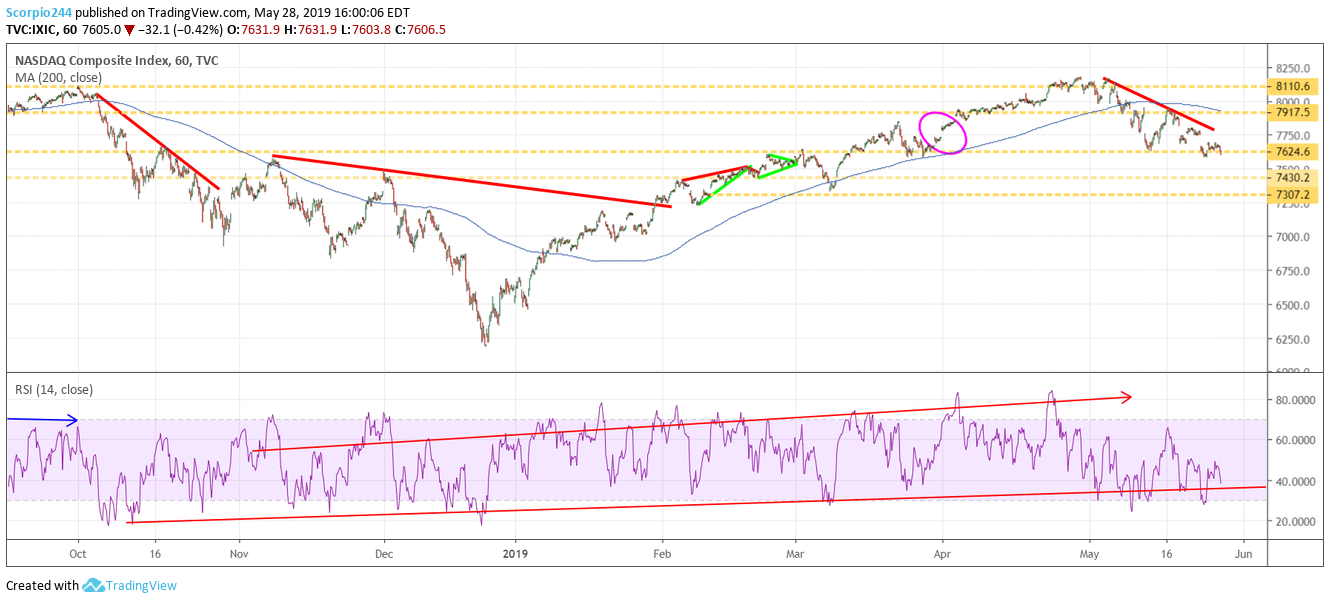
It may be an understatement to say we find ourselves once again in a precarious position.
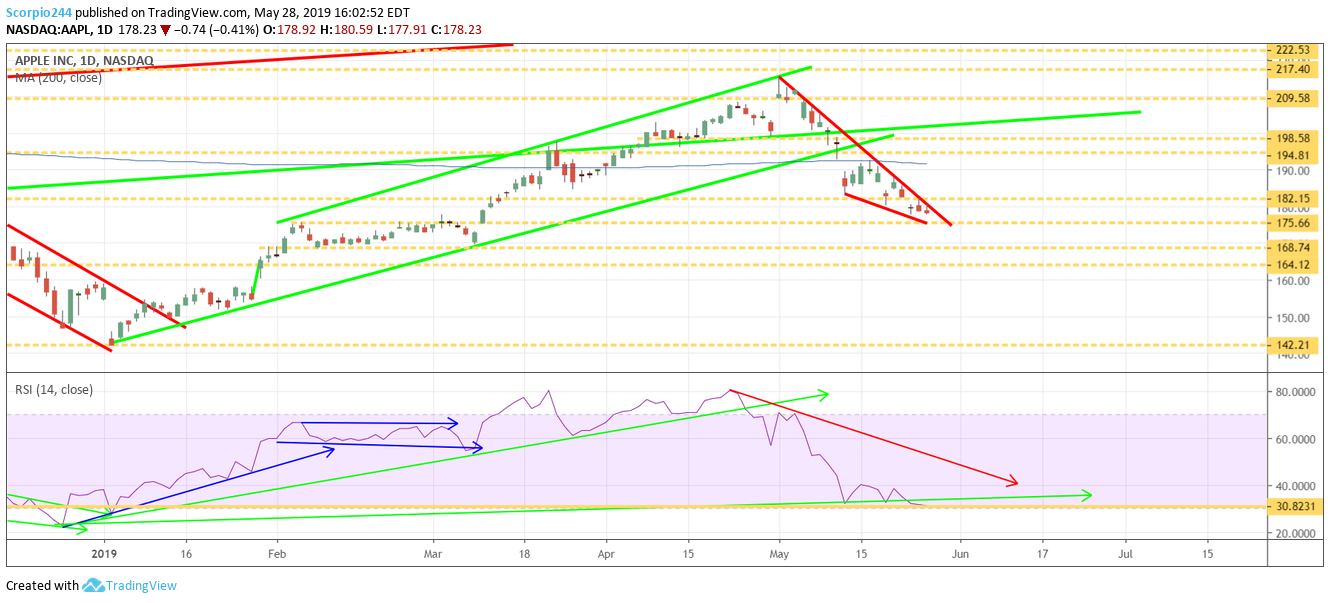
Apple (AAPL)
If there is a shimmer of hope, it is Apple Inc (NASDAQ:AAPL) We can see on the chart how a falling wedge pattern has formed. It is a bullish reversal pattern. But at this point, the chart first suggests there is more for the stock to fall, maybe to $175.
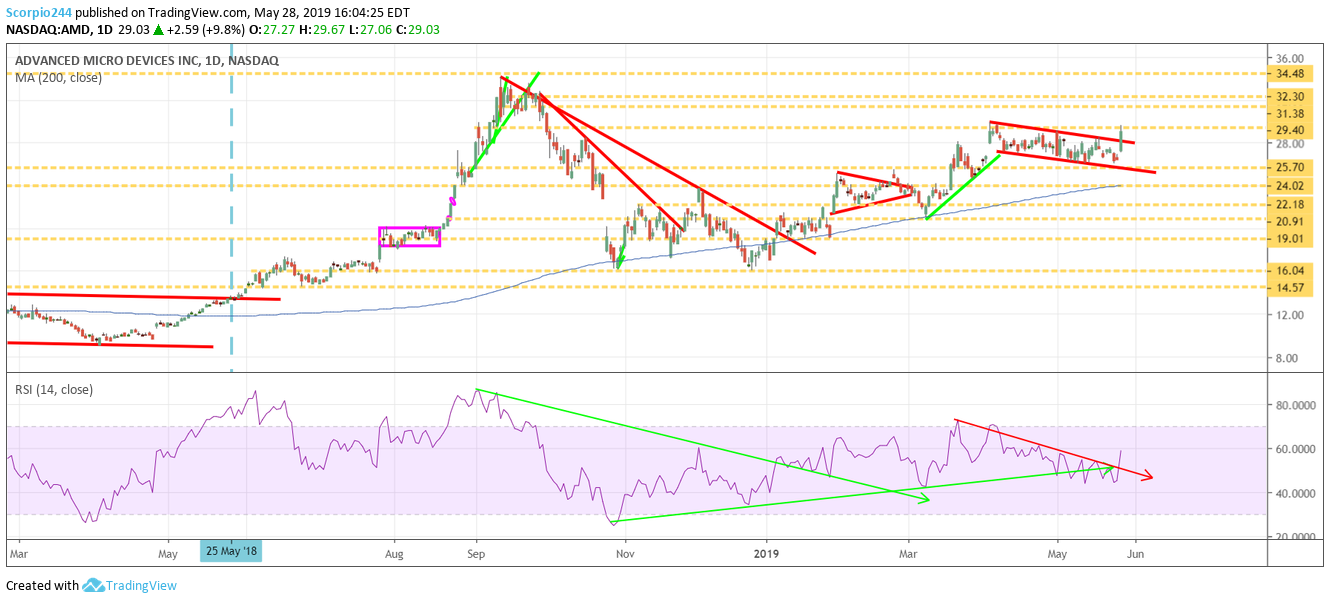
AMD (AMD)
Advanced Micro Devices Inc (NASDAQ:AMD) had a great day rising above the downtrend and testing resistance at $29.40. The RSI broke out today as well. First things first, the stock needs to break through 29.40, then we can think about $31.40.
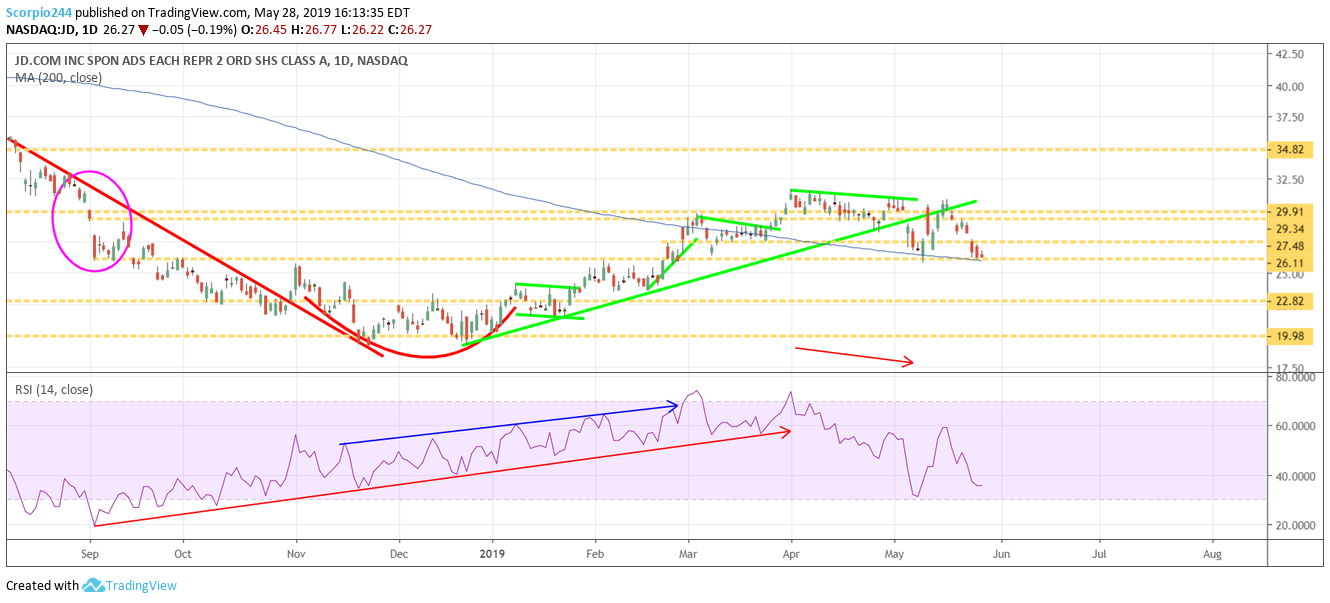
JD.com (JD)
Jd.Com Inc Adr (NASDAQ:JD) appears to be in trouble once again, with a drop below $26 pushing shares to around $23.50.
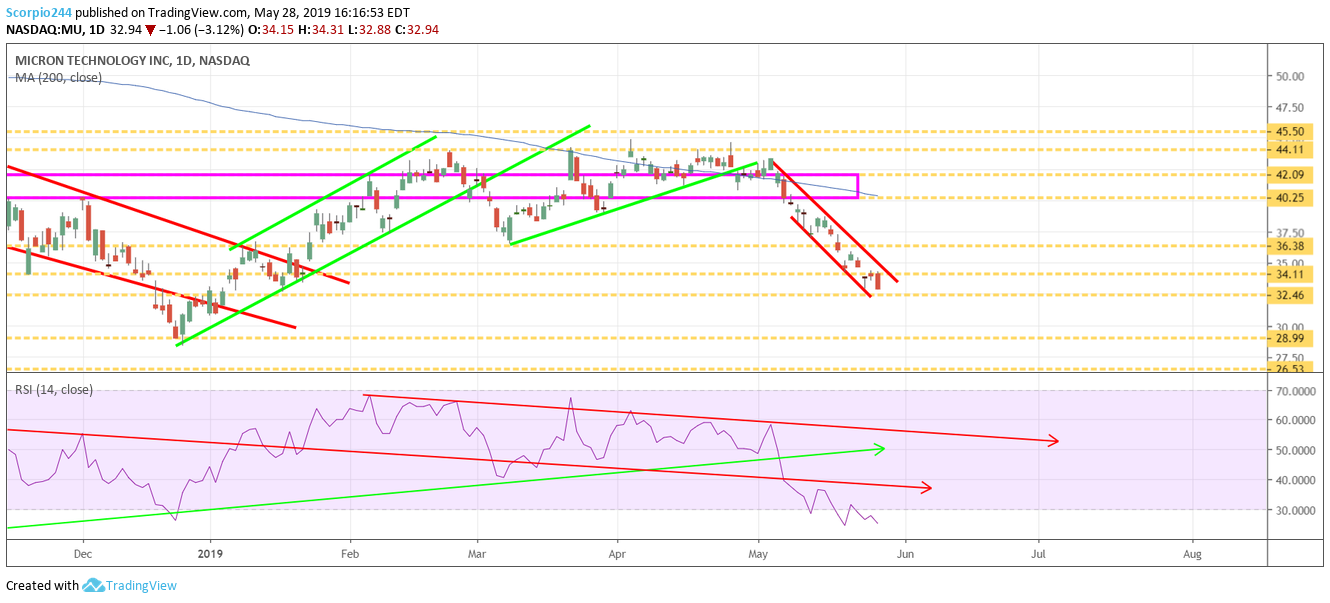
Micron (MU)
Micron (NASDAQ:MU) keeps getting worse, and the decline below $32.50 sets up a drop to $29. Let’s hope that doesn’t happen.
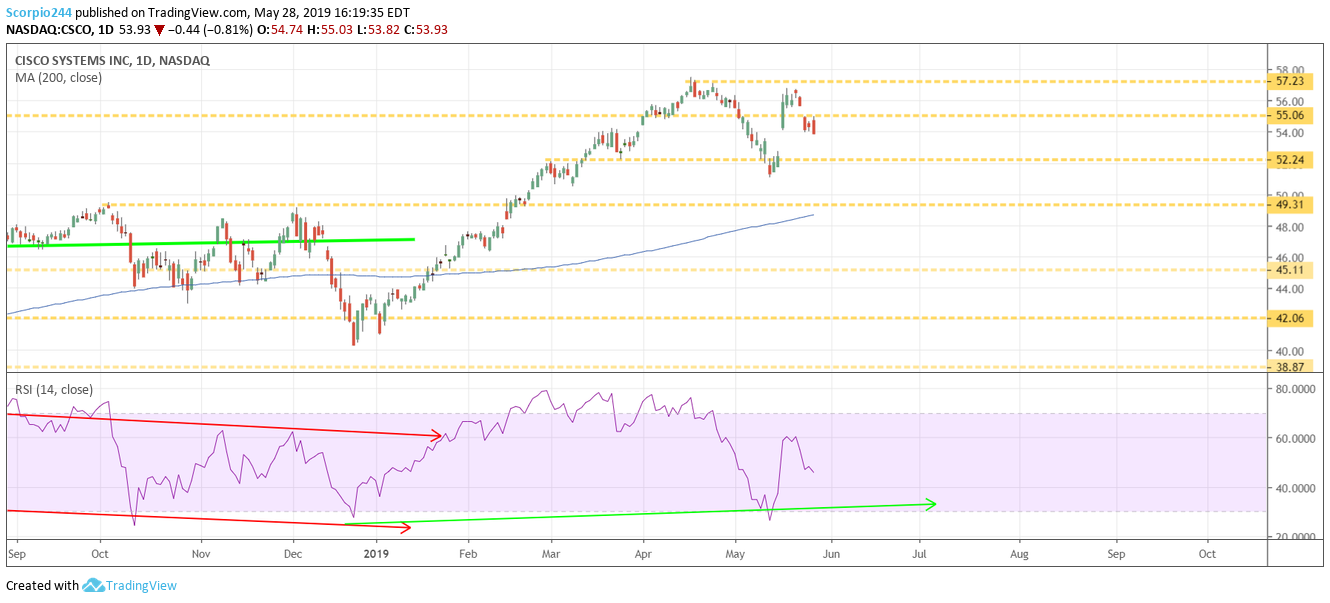
Cisco (CSCO)
Cisco (NASDAQ:CSCO) looks like it may refill the gap to $52.25.
That’s all for today. Just think we start getting PMI’s on Thursday night.