- U.S. futures, European stocks strengthen, China jumps on new Chinese stimulus measures
- Yen, gold drop on risk on
- Treasury yields climb but look poised to resume downtrend
Key Events
Futures on the S&P 500, Dow and NASDAQ 100 consolidated steadily this morning, with SPX contracts retesting the 2,900 resistance level, as global stocks extended Monday's rally even in the face of fresh U.S.-China tensions. While the Chinese foreign ministry said the country will not bow down to threats, by U.S. President Donald Trump, to slap further tariffs on the country if no deal was reached at June's G20 summit, investor sentiment received a boost from a different headline coming from China, where the government prepares to ramp up stimulus.
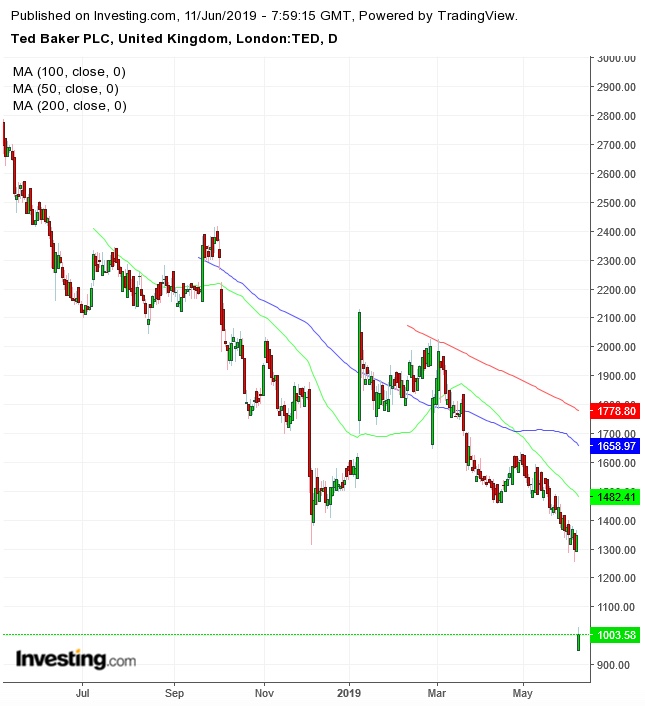
Europe's STOXX 600 climbed with automobile companies and miners for the third straight day as German and Swiss investors played catchup with the market rally—prompted by the halting of the U.S.'s tariff threat against Mexico—after a one-day holiday. British luxury clothing maker Ted Baker (LON:TED), however, plunged as much as a record 30% after the clothing retailer lowered its forecast due to “extremely difficult conditions”.

Dip buyers managed to support the stock price, paring losses to 24%—still the lowest level since November 2012. The price produced a falling breakaway gap, clearing the December 2018 trough’s support at the $1,300 level. Gaps tend to be filled, and the top forms a resistance.
In the earlier Asian session, regional shares climbed across the board, with China’s Shanghai Composite surging 2.58% as local governments were given more leeway to fund infrastructure investments, helping the country's economy offset the negative impact of protracted trade tensions with the U.S..
Global Financial Affairs
Yesterday, U.S. equities edged higher but closed well off their highs. The S&P 500 formed a shooting star, confirming resistance of the right shoulder of an H&S top.

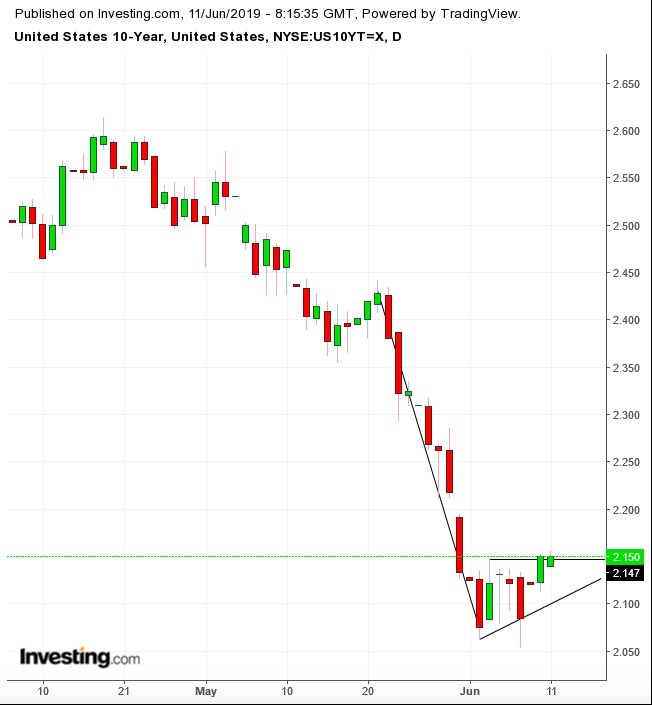
Meanwhile, the yield on 10-year Treasurys remained steady after reaching the top of this month's range on Monday. Should the pattern complete with a downside breakout, it would signal the resumption of a downtrend, suggesting a decline for stocks as well.

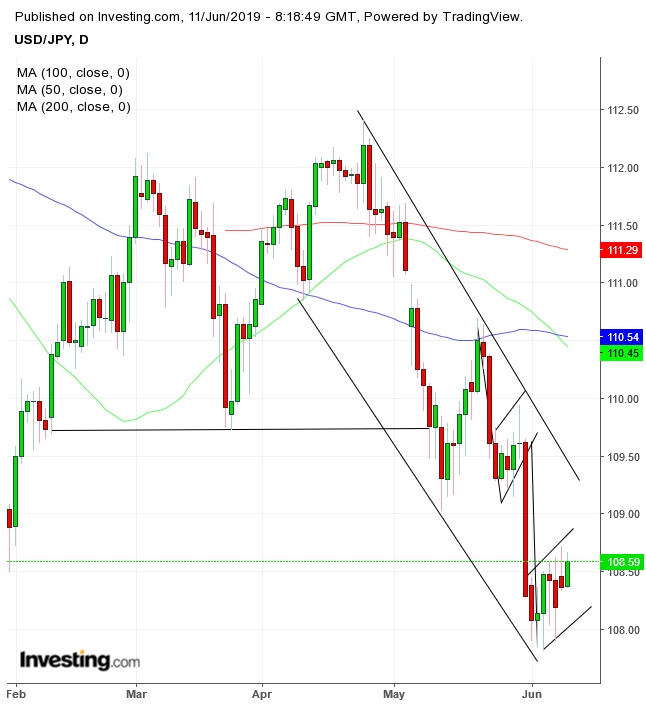
Also, the USD/JPY pair has been forming the second consecutive rising flag. Its downside breakout would demonstrate a continuation of the falling channel.
Gold fell for the second day after failing to post a new high since February, opening the potential for a double-top, whose natural neckline would be the 200 DMA.
Note that while the outlook for the yen and gold suggests risk-on, the expectation that yields will continue to fall weighs on equities. We might be in a unique scenario where bonds rise on the outlook of a contracting economy and stocks climb on the outlook of falling interest rates. Investors are once again focusing on the short term at the expense of the long term. This is a classic Greater Fool rally, when investors know valuations are no longer attractive and no longer worth the growing risks, but yet can’t miss out on the possibility of a further rally, because “everyone else” is buying. They hope that when they buy stocks approaching record levels, there will be someone else—a greater fool—willing to buy.
The Mexican peso stabilized after posting its best day in almost a year, up 2.1%, after the U.S. confirmed it had reached a deal with the Central American country late on Friday. Technically, however, we expect more pain for the Mexican currency.

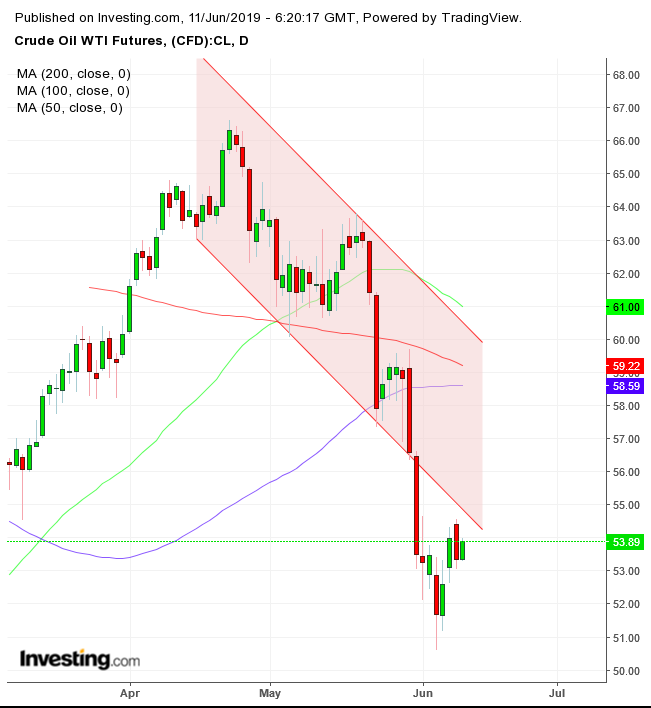
In the commodities market, yesterday’s trading confirmed the resistance levels we expected for WTI, as prices formed a dark cloud cover amid OPEC's struggles to renew supply cuts. Today’s rebound may prove to be a shorting opportunity.
Up Ahead
- The U.S. releases May data on producer prices on Tuesday and consumer prices on Wednesday.
-
- The race to pick a successor to British Prime Minister Theresa May heats up on Thursday, with the first Conservative Party leadership ballot.
- Also on Thursday, euro-area finance ministers meet in Luxembourg. On the agenda: financial penalties for Italy over its debt load and the euro-area budget.
- U.S. Industrial production and retail sales data on comes out on Friday
- China also releases factory output and retail sales on Friday.
Market Moves
Stocks
- The U.K.’s FTSE 100 Index rose 0.4%, hitting the highest in six weeks with its seventh straight advance.
- The MSCI Emerging Market Index increased 0.5%, the highest in more than a month.
Currency
- The Dollar Index slipped less than 0.1%.
- The Japanese yen fell 0.1% to 108.59 per dollar.
- The onshore yuan climbed 0.4%.
- The MSCI Emerging Markets Currency Index edged 0.2% higher on the biggest advance in more than a week.
Bonds
- The yield on 2-year Treasurys dropped one basis point to 1.89%.
- The yield on 10-year Treasurys declined less than one basis point to 2.14%.
- Germany’s 10-year yield fell one basis point to -0.23%.
- Switzerland’s 10-year yield gained three basis points to -0.472% on the first advance in a week.
Commodities
