U.S. stocks have extended their rally after U.S. President Donald Trump said he would delay tariffs on Mexico as a migration deal is arranged. This news added to market exuberance already in place regarding increased bets on a Fed rate cut in reaction to a succession of poor economic data. The prospect of lower rates, coupled with the averted trade peril helped drive stocks higher.
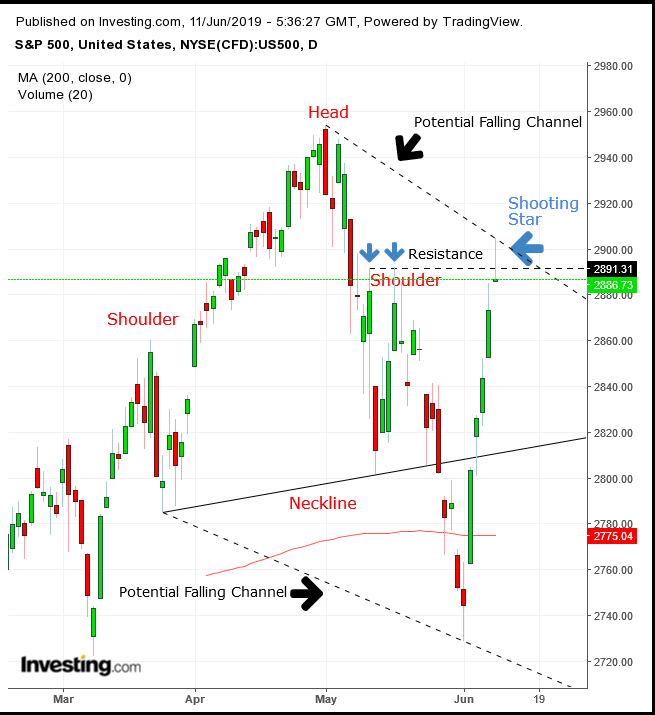
The S&P 500 rose 0.5% yesterday, its fifth straight day of gains. This took the benchmark to 2886.73 at the close — an increase of more than 16% since the start of the year — after it reached an intraday high of 2904.77. Nevertheless, we're picking up several indications that this rebound may not last long.
Trump’s recent threat to revive the specter of increased tariffs on Chinese exports to the U.S. if President Xi Jinping doesn’t meet him at the G-20 summit in Japan at the end of the month, may have pushed prices well off their highs. In addition, technical analysis of the charts is suggesting the possible development of a highly bearish pattern.

Technically, after breaching the 2,900 level yesterday, the price closed below it as traders remembered the 5% drop that occurred when it was close to this level on May 16. Yesterday’s trading pattern produced a shooting star, whose long upper shadow pulled in unsuspecting bulls, fodder for bears.
A shooting star is bearish anytime after a rally, but when it coincides with the left-shoulder’s resistance it confirms — and reinforces — the importance of this price level, with all the punch that anticipation and interest packs. But there’s more.
The shooting star developed after an up gap. While that may be enough, again, its location on the chart meant it created the scenario for an evening star, in Japanese candlesticks, or an island reversal, in Western technical analysis.
The pattern includes three sessions. An advance, a rising gap – reinforcing the outlook for a continued rally, pulling in more bulls – and the third, a decline, that stops out all the bulls, emboldens the bears and pulls into the market those who are undecided.
If today’s candle dips into Friday’s long, green candle – with a falling gap further enervating traders, as they lose more than their stop-losses – we will receive another, reliable bearish signal.
Trading Strategies
Conservative traders would wait to go long either for a new record high, or for a new series of descending peaks and troughs, as Monday’s intraday price posted higher than the previous peak on May 16, muddling the trend.
Moderate traders might enter a short position after the evening star completes with today’s candle falling below 2,860 on a closing basis.
Aggressive traders may short now and consider the rise in futures a rare gift, rising against both the fundamentals and the technicals.
Trade Sample
- Entry: 2,900
- Stop-Loss: 2,905
- Risk: 5 points
- Target: 2,885 – yesterday’s closing price
- Reward: 15 points
- Risk-Reward Ratio 1:3
Which stock should you buy in your very next trade?
AI computing powers are changing the stock market. Investing.com's ProPicks AI includes 6 winning stock portfolios chosen by our advanced AI. In 2024 alone, ProPicks AI identified 2 stocks that surged over 150%, 4 additional stocks that leaped over 30%, and 3 more that climbed over 25%. Which stock will be the next to soar?
Unlock ProPicks AI
