- Renewed U.S.-China trade uncertainty hits Europe, U.S. futures
- Nikkei hits 2-month high as BoJ's Kuroda signals easing; S&P/ASX climbs on safety-driven big banks' rally
- Dollar and gold rise together on broad risk-off shift
Key Events
European markets gave up an initial charge to highs not seen since October this morning, ending a two-day advance. Technically, the price retreated from the 200 DMA. Futures on the S&P 500, Dow and NASDAQ 100 also fell from an early advance, extending a decline to a second day.
While some media outlets attribute the initial rise in equities to optimism around U.S.-China trade talks, others blame the very same market theme for the decline that followed.
What we do know is that HSBC (LON:HSBA), Europe’s largest bank, missed 2018 profits estimates. In fact, it fared as the banking sector's main laggard. What does it mean for Europe’s economic growth that its biggest lender is falling short of expectations? Moreover, the bank blamed its woes on China's economic slowdown, further exacerbating fears of the end of the longest bull stock market in history. Adding to the pressure, Brexit looms around the corner, threatening to yield yet more unpleasant surprises.
In the earlier Asian session, stock indices were mixed, as investors sought direction after U.S. market closure on Monday, for the President’s Day federal holiday. Emerging signs of a trade fallout between the world’s two largest economies didn't help market sentiment either.
The current situation well exemplifies how uncertain and potentially explosive geopolitics could levy a commensurate effect on markets. While the Trump Administration said yesterday that trade negotiations will resume in Washington on Tuesday, preparing for higher-level talks next week, Chinese sources suggested that the U.S. is not dealing in good faith and may be trying to hinder China's competitive market advantage by targeting the country's mobile network technology on grounds of cyber security risk.

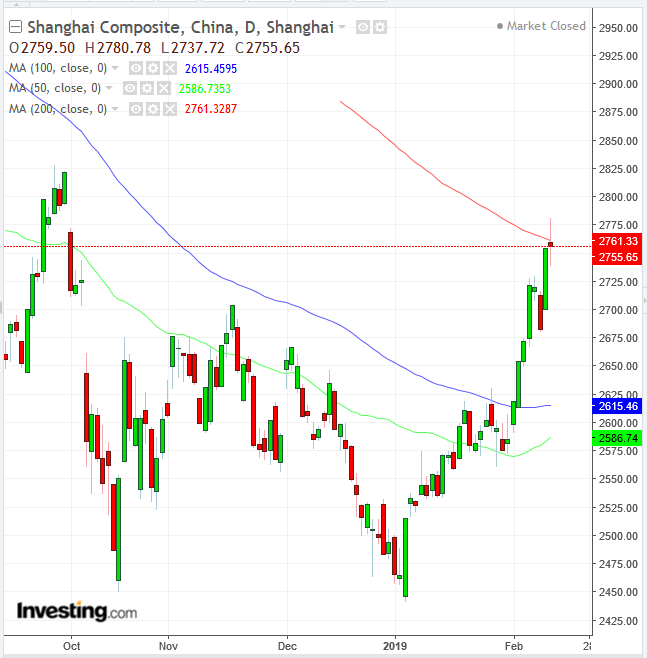
China’s Shanghai Composite (+0.05) ended flat, after shares swung between a 0.65% loss and a 0.91% gain. The price clung on to yesterday’s 2.68% jump and to the near 7% gain since the beginning of the month, as well as to a near-five-month high.
On the other hand, today’s wide swings formed a high wave candle, suggesting a lack of leadership—also considering it occurred after a failed attempt to scale above the 200 DMA.
The questions investors need to ask themselves is whether the 2.83% penetration of a double-top neckline is enough to assume that a downward correction would only reach the neckline at the 2,700 level as part of a return-move or whether this increases the potential for a pattern failure, as Chinese stocks head lower and their bear market slips into fully-fledged hibernation.
The index's relevance stems from the fact it projects the forward-looking price of the world’s second largest economy, whose slowdown—associated with the 11-month old trade dispute with the U.S—has already been weighing on global investor sentiment.
Hong Kong’s Hang Seng retreated 0.42% after briefly touching a near-week high. Japan’s Nikkei 225 edged 0.1% higher to a more than a two-month high, after Bank of Japan's Governor Haruhiko Kuroda said the central bank is considering further easing. South Korea’s KOSPI slid 0.24%, extending February’s range.

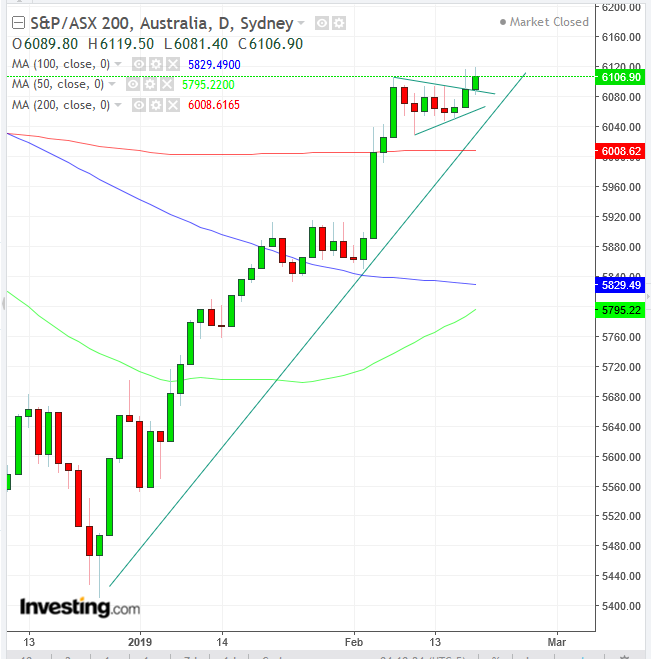
Australia’s S&P/ASX 200 (+0.28%) outperformed its regional peers, helped by a jump in big banks' stocks, viewed as a safe haven. The index reached the highest since Oct. 5, as it broke topside of a pennant, a continuation pattern. The fact that the pattern formed above the 200 DMA reinforces its bullish implication, which is further confirmed by the 50 DMA rising toward the 100 DMA.
Global Financial Affairs
Trade talks' uncertain outcomes only add to the other numerous headwinds stemming from Fed policy, late business cycle, U.S. debt levels and U.S. politics, to cite a few. Considering U.S. shares jumped nearly 20% since after Christmas, the risk is to the downside, in our opinion.
Perhaps, minutes from the last FOMC meeting, coming out on Wednesday, will shed clarity on what precisely Fed Chair Jerome Powell meant with the words “patience” on rates and “flexibility” on balance sheet normalization. Was he signaling a policy shift—as the recent market narrative seems to indicate—or was he simply adjusting to a lack of hard data due to the recent government shutdown? Either way, it’s going to be a bumpy ride for the equity market.

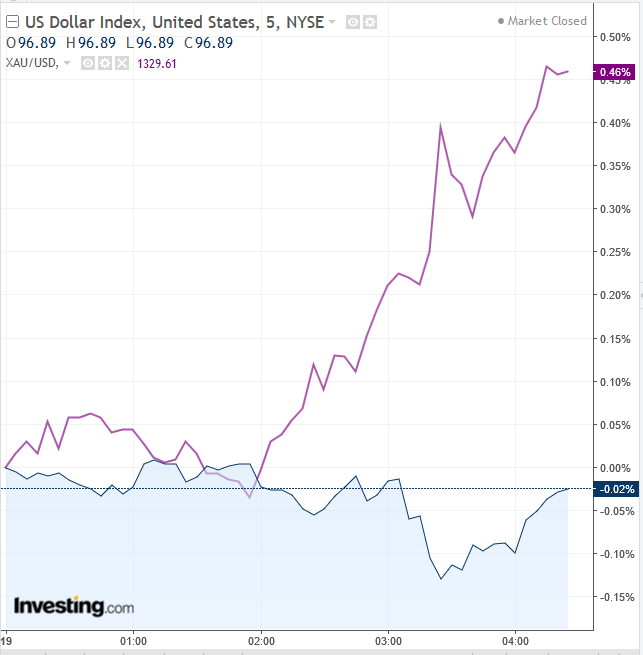
Meanwhile, the dollar and gold climbed in unison—a rare occurrence—as the greenback switched to safe-haven mode. However, the buck wavered by the late European morning.
Up Ahead
- The Federal Reserve will publish minutes from its latest monetary policy meeting on Wednesday.
- Bank of Canada Governor Stephen Poloz speaks on Thursday
- ECB President Mario Draghi speaks on Friday
- Also on Friday, Reserve Bank of Australia Governor Philip Lowe testifies before the parliament.
Market Moves
Stocks
- Futures on the S&P 500 was unchanged at the highest in 11 weeks.
- The STOXX 600 gained 0.1 percent to the highest in 19 weeks.
- The MSCI All-Country World Index increased less than 0.05 percent to the highest in almost 15 weeks.
- The MSCI Emerging Market Index fell 0.2 percent.
Currencies
- The Dollar Index jumped 0.1 percent.
- The euro was unchanged at $1.1311, the strongest in a week.
- The Japanese yen slipped 0.1 percent to 110.74 per dollar.
- The British pound gained less than 0.05 percent to $1.2928, the strongest in more than a week.
- The MSCI Emerging Markets Currency Index declined less than 0.05 percent.
Bonds
- The yield on 10-year Treasuries increased one basis point to 2.67 percent.
- Germany’s 10-year yield climbed one basis point to 0.12 percent.
- Britain’s 10-year yield gained one basis point to 1.174 percent.
- The spread of Italy’s 10-year bonds over Germany’s fell three basis points to 2.6213 percentage points to the narrowest in more than two weeks.
Commodities
- The Bloomberg Commodity Index gained 0.5 percent to the highest in more than a month.
- Brent crude climbed 0.2 percent to $66.64 a barrel, hitting the highest in three months with its sixth straight advance. The oil market is now caught in between OPEC production cuts and U.S. efforts, via NOPEC legislation, to limit the autonomy of the oil-producers cartel.
- LME copper edged 0.1 percent higher to $6,282.00 per metric ton, reaching the highest in 11 weeks on its fifth consecutive advance.
- Gold dropped less than 0.05 percent to $1,326.39 an ounce.
