-
NASDAQ and S&P futures surge
-
European and Asian stocks rally
-
Risk assets rise as safe havens slide
-
Traders bet on Trump bluffing but investor outlook on trade war risk remains
-
Oil and metals lead-bounce back of commodities
Key Events
Futures are currently pointing to a higher open for major US indices, as the trading week begins, after Friday’s nosedive for stocks. NASDAQ 100 Futures climbed 0.84 percent, racing ahead of S&P 500 futures, which surged 0.65 percent.
Stocks in Europe are also on an upward trajectory, led by bank shares and builders, following a strong Asian session that saw all key benchmarks gain.
Hong Kong’s Hang Seng led the pack with a 1.5 percent jump. Mainland Chinese investors drove up prices, showing little concern for the most recent tit-for-tat tariff brinkmanship between China and the US, boosting the Shanghai Composite, as the exchange re-opened for the first time since the start of last Thursday's Ching Ming Festival.
Further signaling renewed confidence, investors shrugged off the potential shadow of a trade war and rotated out of safe havens and into risk assets. Gold, the Japanese yen and Treasury yields all retreated.
Global Financial Affairs

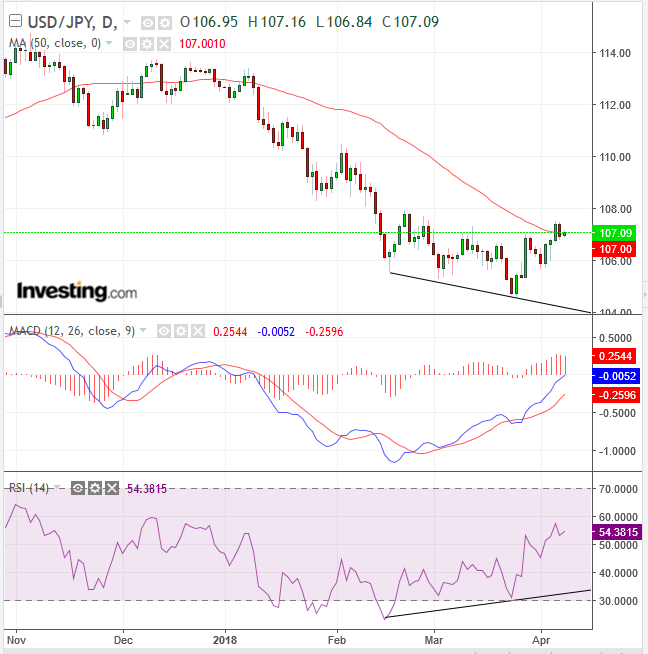
Since last March, the yen has weakened against the dollar, supported by positive divergences of the MACD and RSI. The pair found resistance, however, at the 50 dma.
Even this morning's activity in the Middle East, when several missiles hit a Syrian air base after yesterday's reported chemical weapons attack on civilians by Syria's military near Damascus, failed to sour investors’ mood. The US Pentagon defensively denied involvement in the Homs base attack but Russia is claiming Israel carried out the action. As of this writing, Israel has declined to comment.

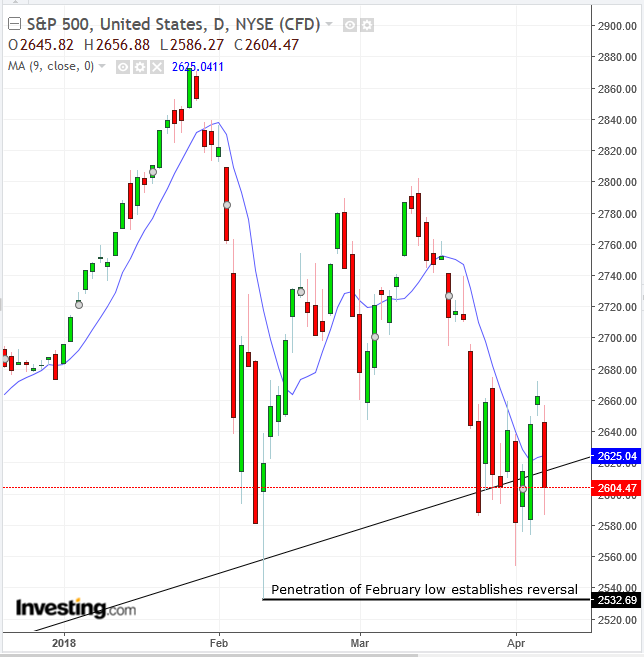
Friday’s sell-off left the S&P 500 below a key support level: an uptrend line since the February 2016 bottom. However, stocks are still holding above two other key support levels: the 200 dma and the February 2018 lows, whose penetration would establish a trend reversal. While the repeated retesting of these levels should raise a red flag, Ralph Acampora, dubbed the godfather of technical analysis, said that as long as the February lows are intact, the market still holds the benefit of the doubt.
While the US-China trade dispute remains the dominant theme, investors seem to believe it is mainly a grab at strategic political leverage and that it will eventually be resolved. Trump has historically followed a pattern of starting with a tough negotiation stance, then gradually moving toward a middle ground. This is the opposite of former US President Theodore Roosevelt’s “speak softly, and carry a big stick” foreign policy.
It's also the fourth time in the last 11 sessions that traders have opted to ignore any previous caution they may have had on the matter of a possible trade war. As such, today’s advance fits the consolidation pattern seen in the last two weeks and confirms the lack of a real bullish tendency in the overall market.
It's not just hope that's fueling the change in sentiment. Yesterday, Trump claimed that China will ease trade restrictions “because it’s the right thing to do,” and added that the two countries will reach a deal on tax reciprocity and intellectual property.
Attention now turns to Beijing’s Boao Forum for Asia, which began yesterday and runs through Wednesday, where investors may seek confirmation of Trump’s statements from Chinese President Xi Jinping, who is among the senior officials scheduled to speak.

Commodities rebounded from their worst weekly drop since mid-March, with crude oil and industrial metals rallying. Aluminum on the London Metal Exchange rallied for a fourth day after the US imposed new sanctions on Friday against Russian oligarch and aluminum magnate Oleg Vladimirovich Deripaska.
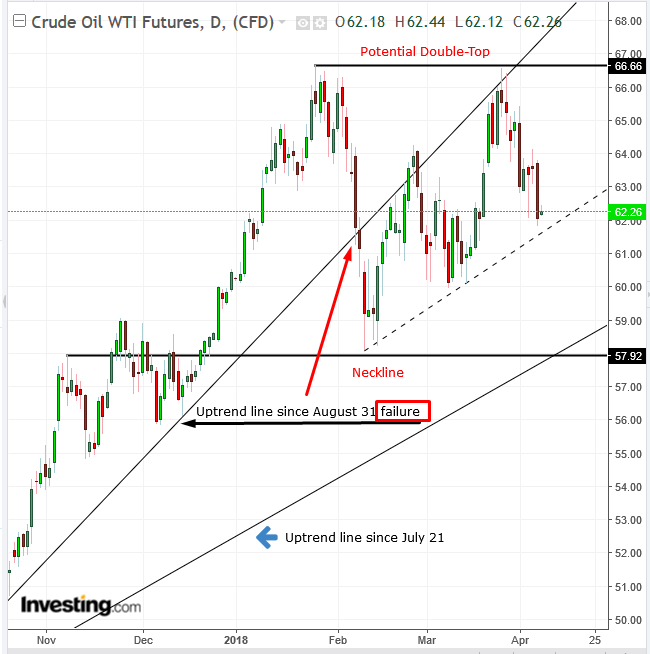
WTI crude failed to register a higher peak within the uptrend, after falling below the uptrend line since August 31, thereby increasing the probability of the price falling to the flatter uptrend line since July 2. Should that uptrend line fail to support the price, it further raises the chances for a double top reversal.

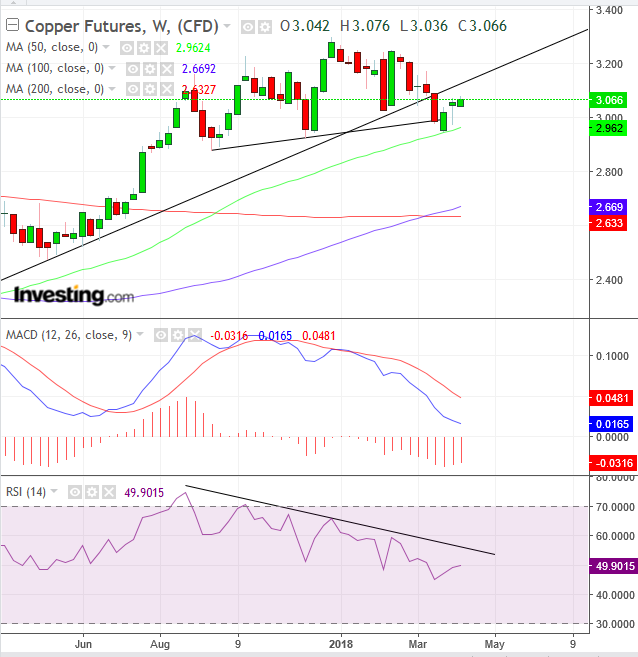
In late March, copper bounced off the support line of a potential top and the 50-week MA. However, the red metal is still below the uptrend line since October 2016, beneath which it crossed mid-March. Both MACD and RSI provide negative divergences, triggering sell signals.
Up Ahead
-
The Bank of Japan's Governor Haruhiko Kuroda speaks at the start of his second term.
-
President Xi Jinping gives a keynote address at the Boao Forum on Tuesday.
-
Facebook’s (NASDAQ:FB) CEO Mark Zuckerberg testifies at two Congressional hearings on Tuesday and Wednesday.
-
US CPI data and FOMC minutes are due on Wednesday.
-
First-quarter earnings for JPMorgan and Citigroup will be reported on Friday.
Market Moves
Stocks
-
The STOXX Europe 600 gained 0.2 percent.
-
Futures on the S&P 500 jumped 0.7 percent.
-
The MSCI All-Country World Index climbed 0.2 percent.
-
The UK’s FTSE 100 gained 0.3 percent to the highest level in four weeks.
-
Germany’s DAX fell 0.5 percent.
Currencies
-
The euro sank 0.1 percent to $1.2268.
-
The Dollar Index gained 0.05 percent, fluctuating from a 0.15 percent gain and remaining flat.
-
The Japanese yen fell 0.1 percent to 107.01 per dollar.
-
The British pound dipped less than 0.05 percent to $1.4091.
-
South Africa’s rand climbed less than 0.05 percent to 12.0326 per dollar.
Bonds
-
The yield on 10-year Treasuries gained two basis points to 2.79 percent.
-
Britain’s 10-year yield increased less than one basis point to 1.396 percent.
-
Germany’s 10-year yield was unchanged at 0.50 percent, the lowest in almost three months.
Commodities
-
WTI crude increased 0.3 percent to $62.25 a barrel.
-
Gold slid 0.1 percent to $1,331.06 an ounce.
-
LME copper rose 0.9 percent to $6,830.00 per metric ton, the highest in three weeks.
-
The Bloomberg Commodity Index gained 0.3 percent to the highest level in more than a week.
