Review and Update
Just a short note this week, since there has literally been “nothing” happening. As I penned in Friday’s reading list:
“This…has…to…be…the…most…boring…market…ever.”
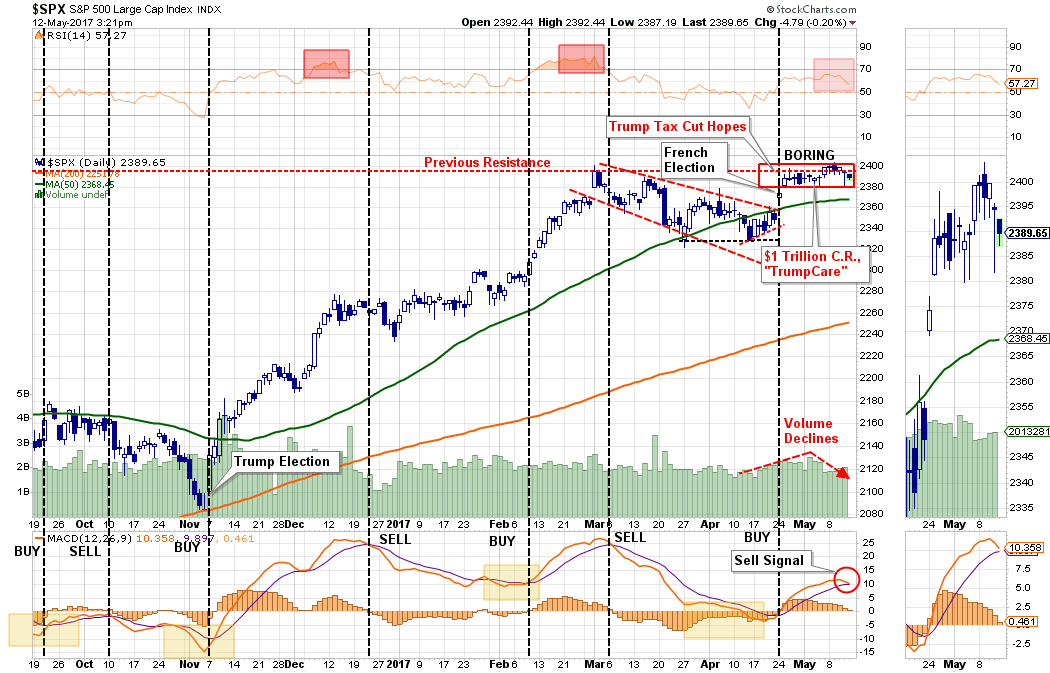
“For almost a month now, the market has gone literally nowhere. Despite news of the passing of the American Health Care Act, the Continuing Resolution, or “stellar” earnings reports…nothing seems able to excite either the bulls or the bears.
Boring.”
Importantly, the “buy” signal that was registered in late April is very close to tripping a short-term sell signal. These signals have usually been indicative of short-term S&P 500 correction actions which can provide for better entry points for trading positions and rebalancing.
However, as shown below, on a longer-term basis the backdrop is more indicative of a potential correction rather than a further advance. With an intermediate-term (weekly) “sell” signal triggered at historically high levels, the downside risk currently outweighs the potential for reward.
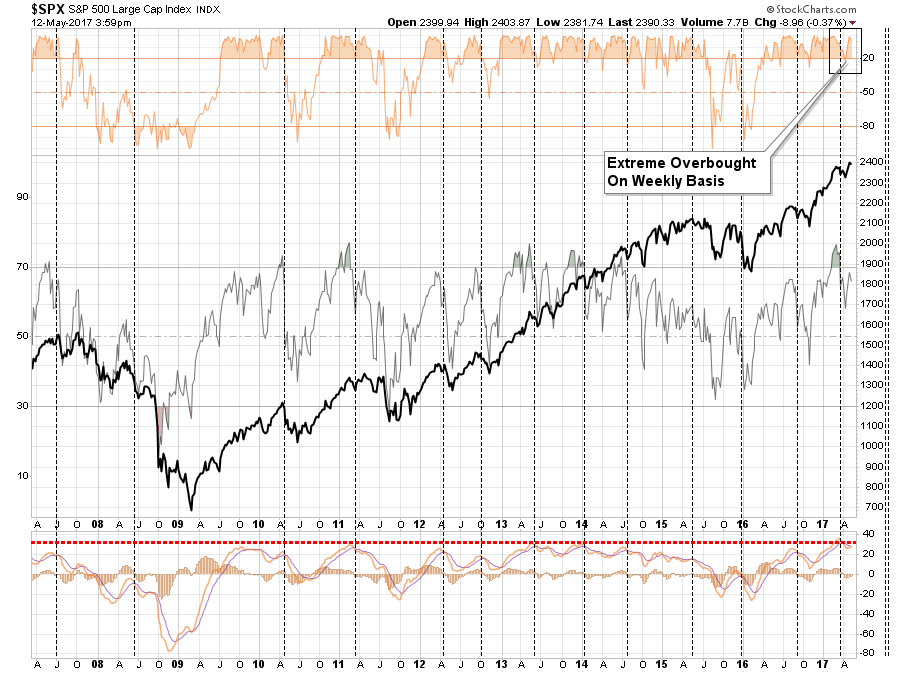
Despite a “belief” that “This Time Is Different (TTID)” due to Central Bank interventions, the reality is that it probably isn’t. The only difference is the interventions have elongated the current cycle, and has created a greater deviation, than what would have normally existed. What is “not different this time” is the eventual reversion of that extreme will likely be just as damaging as every other previous bear market in history.
But, of course, “TTID” is the old Central Bank driven mantra, today it is “There Is No Alternative (TINA).” As stated, regardless of what you call it, the results will eventually be the same.
VIX and Junk Bond Spreads Out Of Whack
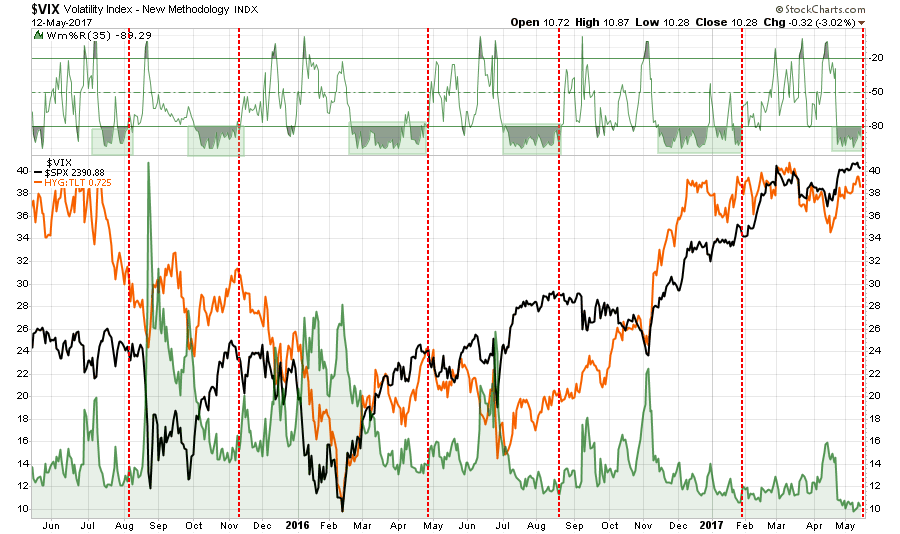
The level of “complacency” in the market has simply gotten to an extreme that rarely last’s long.
The chart below is the comparison of the S&P 500 to the Volatility Index. As you will note, when the momentum of the VIX has reached current levels, the market has generally stalled out, as we are witnessing now, followed by a more corrective action as volatility increases.
As was noted last week by John Mauldin:
“There have been only 11 days out of some 6900, going back almost 28 years, when we’ve had a sub-10 VIX. When I look carefully at those dates, the word complacency leaps to mind.”
He is right. And the problem with complacency, like everything else in the world, is that it comes and goes in cycles. The chart below is the MONTHLY read on the volatility index as compared to the S&P 500 index. I have marked the previous low levels of the volatility index and the subsequent corrections.
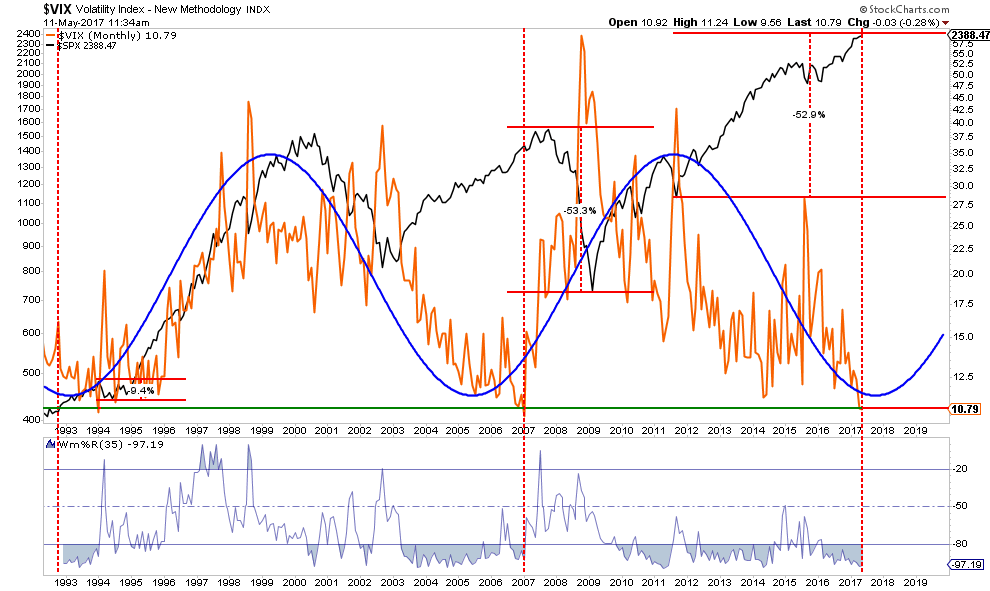
It should be noted the correction in 1994, while small, was following the recession of 1991 as the market was just beginning to enter into the “dot.com” craze. The current environment more closely resembles that of 2007 as the market heads toward the END of a bullish phase with valuations extended, exuberance high and fear extremely low. (I have marked a similar correction back to the 2011 support levels.).
Like high levels of margin debt, low levels of volatility is not a problem…until it is. Falling levels of volatility, like rising levels of margin debt, are not good leading indicators to predict a change in market behavior. However, margin debt, corporate leverage, volatility, when eventually ignited by some catalyst, is the equivalent of throwing a stick of dynamite into a tanker of gasoline.
More on that story here.
For now, the market remains boring as investors rush to “buy in” to the bull market exuberance. However, as my partner, Michael Lebowitz noted last week that may not be the best of strategies.
“Interestingly, based upon the CAPE analysis above, the U.S. stock market is currently offering that very same probability of return and risk and buyers cannot seem to get enough. Given these dynamics, not only is investor behavior perplexing, it seems to us altogether incoherent which in our view provides further evidence bubble behavior is upon us. For the sake of illustration, the graph below provides three random scenarios showing how such an expected return and drawdown could play out over the next five years. None of these, nor the infinite myriad of other possible paths, appeal to us.”
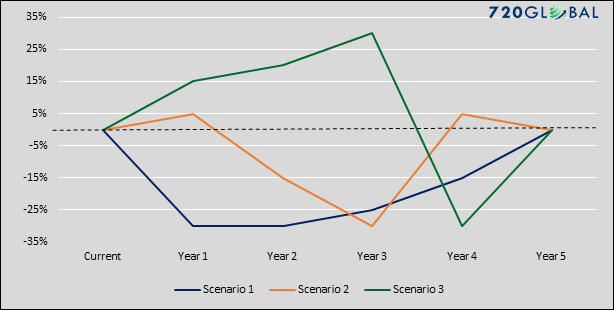
“In a sinister rhyme to that of the early 1980’s, equity market valuations have been rising so steadily for so many years now that the trend has become a permanent state in many investors’ minds. The “investors” identified in Ben Graham’s quote do not acquiesce to the crowd or bet on whims. Instead, they carefully assess an investment’s potential risk and expected return to make calculated decisions. The virtue of this time-honored practice of cost-benefit analysis does not reveal itself every day but avoiding the pitfalls, even if it means foregoing additional speculative gains, has a long and proven track record of compounding wealth over time.”
It seems as if investors will never learn.
As always, timing is everything.
For now, the “risk to reward” dynamic for either adding to current long positions, or maintaining overweight equity positions, in portfolios is not favorable. Therefore, we continue to maintain a slight overweight in cash for existing portfolios while we await a better investment opportunity.
A Note On Risk Management
Managing money is about managing the risk of loss. Notice that I did not say “creating returns.”
If I manage portfolios against the potential of long-term impairment of capital, the creation of returns becomes a byproduct of that effort.
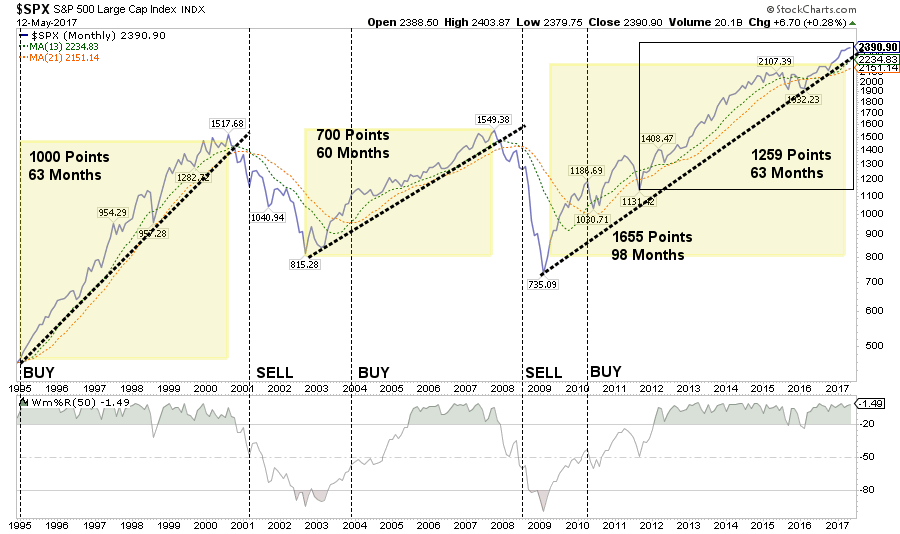
Currently, while there is a very bearish case to be made from the deterioration of economic and fundamental variables relative to the market, the current technical price dynamics remain bullish and positively trending. Therefore, as a money manager, I want to maintain exposure to the equity markets until such time as the technical price dynamics change from bullish to bearish.
There is little doubt the financial markets are currently within a bullish trend which requires maintaining a higher equity weighting in portfolios currently. This bullish trend is clearly shown in the chart below.
The current advance has been driven by several artificial factors as previously noted by Doug Kass:
- Central-bank policies are succeeding in encouraging risk takers to take more risks in long-duration financial assets, while central-bank purchases have sent financial-asset prices spiraling upward and reduced volatility (as measured by the VIX). This has created what I call the Bull Market in Complacency — an almost universal view that any drawdown in market prices will be limited.
- Many U.S. corporations that face lackluster top-line growth are repurchasing stock in record amounts at record prices rather than doing capital spending to bolster their physical plant. This boosts stock prices, satisfying large shareholders and feathering insiders’ portfolios.
- While many retail investors are long gone from the stock market, volatility-trending strategies, risk-parity trading systems and other quant-programs keep pushing stock prices to new all-time highs.
All this feeds on itself, but what’s surprising is that few question how the above factors contribute to higher asset prices. They fail to recognize that if there were no adverse consequences to low or negative interest rates, massive liquidity injections, and central banks buying stocks, these would have become permanent and continuous monetary-policy strategies decades ago.
The reality is the next major decline will likely be breath-taking as the limits of “financial engineering” are ultimately realized. That decline could be caused by any one, or a combination, of issues. Doug continues:
- “An Abrupt Growth Slowdown. Low U.S. interest rates have pulled forward demand, and from my perch, we’re already seeing ‘Peak Autos’ and ‘Peak Housing.’ I wonder whether U.S. consumer spending’s recent strength is sustainable … or just the last gasp of growth?
- A Possible Deeper ‘Earnings Recession.’ Will corporate profit margins get squeezed even further going forward? (Keep a watch on PPI)
- An Abrupt Reversal for Stocks. This could ‘just happen’ out of the blue, or it could stem from an exogenous political or geopolitical shock. Or it could follow something else that investors aren’t even thinking about. My concern is that an abrupt change in sentiment or stock prices could ignite a selling stampede from the influential quant community, just as ‘portfolio insurance’ precipitated the October 1987 Wall Street crash.
- A Quick Climb in Interest Rates. This could, among other things, curtail mergers and acquisitions and/or stock-repurchase programs.
- An Abrupt Rise in Inflation or Inflationary Expectations. This could spark higher interest rates.
- A Federal Reserve Policy Mistake. We can never rule this out.
- A European Banking Crisis. This could have a “contagion effect” around the world.
- Policies that Destabilize Currencies. Again, this is always a possibility.
- A Monumental Hacking. A major computer hack of the U.S. banking and investing complex could disrupt everything.
- Something Else. We face all sorts of other risks that no one is even considering.
The Bottom Line
I agree with Doug. The view of “TTID” or “TINA” will likely end very badly for investors over the longer-term time frame. Distortions of price from reality are short-term, emotionally driven, cycles.
With the S&P 500 trading at more than 25x GAAP earnings, 18x non-GAAP profits (one of the largest differentials between GAAP and non-GAAP in history), risk vs. reward is simply not present in the long-term.
However, in the short-term, we must recognize the potential for the markets to remain “irrational” longer than logic would currently dictate. This is why I am cautiously managing portfolio risk and allowing the markets to “tell me” what to do rather than guessing at it.
What happens over the next few days to weeks is really anyone’s guess. But, over the longer-term time horizon, I am unashamedly bearish as the current detachment between prices and fundamental reality can not last forever.
Eventually, something’s gotta give.
“A bull market lasts until it is over.” – Jim Dines
See you next week.
Market and Sector Analysis
Data Analysis of the Market and Sectors for Traders
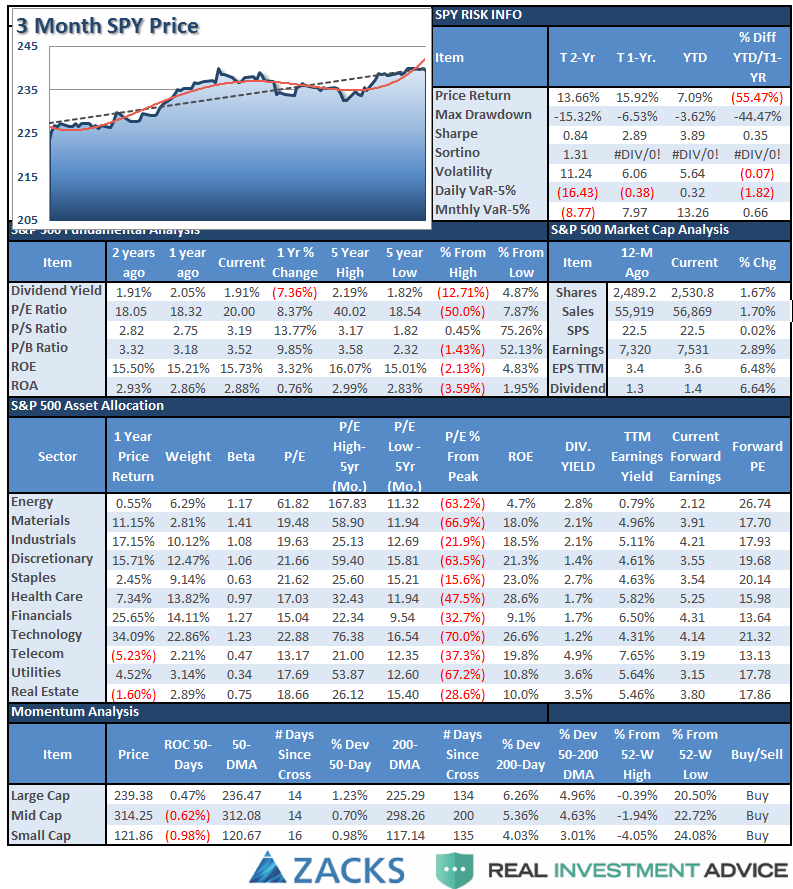
S&P 500 Tear Sheet
The “Tear Sheet” below is a “reference sheet” provide some historical context to markets, sectors, etc. and looking for deviations from historical extremes.
If you have any suggestions or additions you would like to see, send me an email.
NEW! Performance Analysis
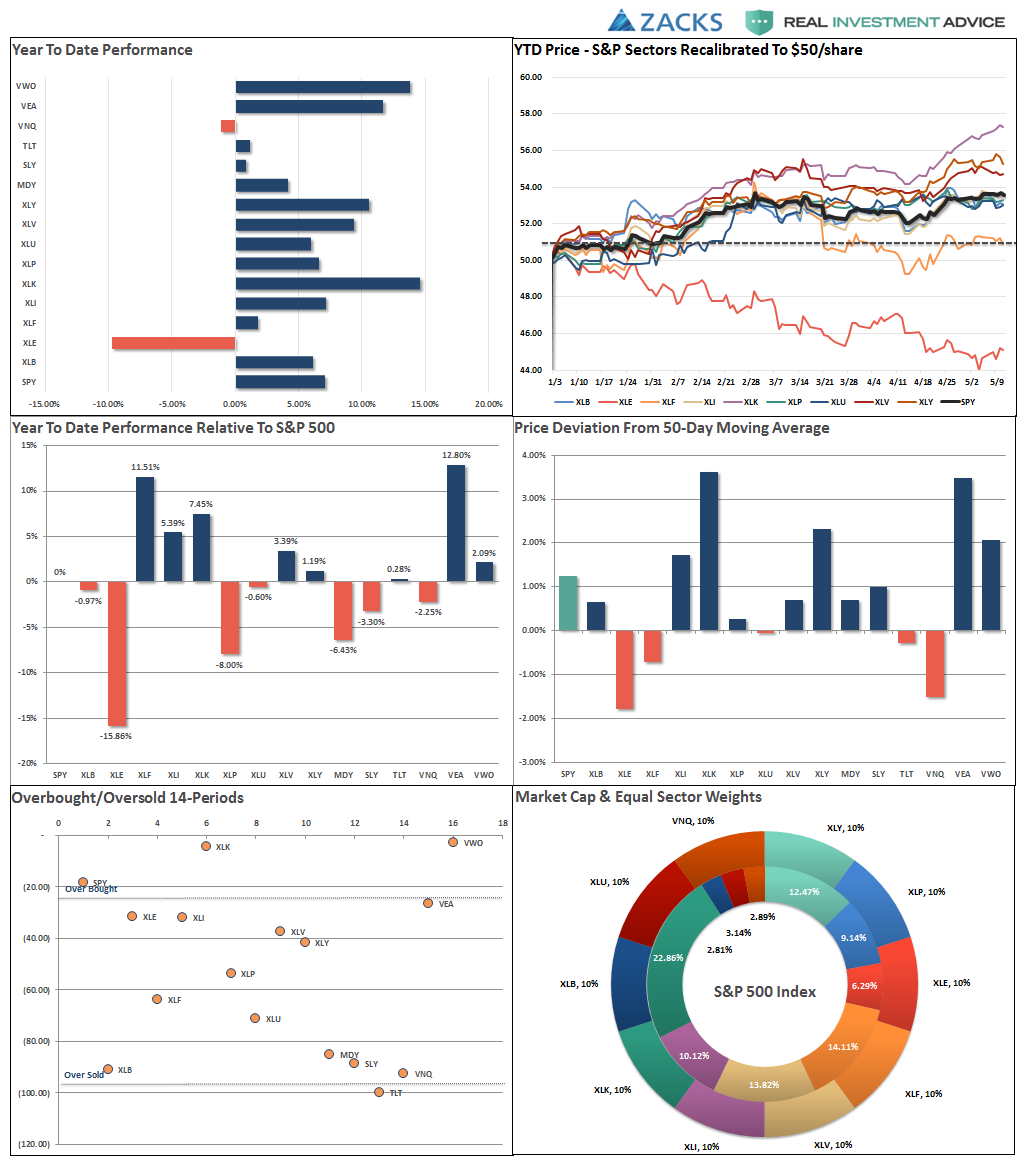
Sector Analysis
From last week:
“With that being said, the overall backdrop remains BULLISH for now. I do remain somewhat cautious on allocations currently given the ‘weekly sell signal’ alert remains intact currently and at a high level.
However, let me reiterate, I remain long-biased in portfolios currently, but am also maintaining fairly tight stop-loss levels as well as hedges currently. Although we did lighten up on those hedges a few weeks ago.”
As noted in the chart below, the bullish trend line from the 2016 lows remains intact for now. However, a break of that trendline will likely signal a bigger correction in the works. Stops have been moved up to previous lows set during the March correction. Any correction that violates critical support at 2015 highs (an -11.3% decline from recent highs) will signal the onset of a more severe bear market correction back to the 2016 lows at 1825ish (-24.3%) The previous correction in 2015-2016 was just -14.7%.
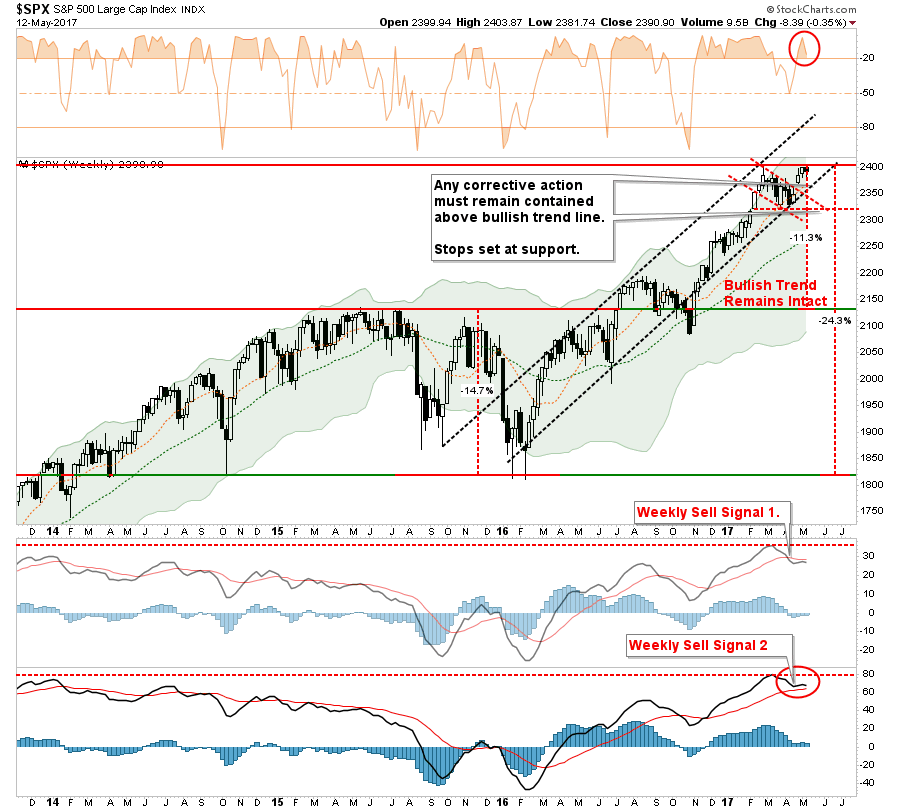
Of course, as I have stated many times previously, given the extreme length of time the market has remained in a low-volatility state will magnify the “psychological pain” of a correction. In other words, for overly complacent investors, a correction of 10%, or more, will “feel” much worse than it actually is.
Okay, let’s get to the sector analysis.
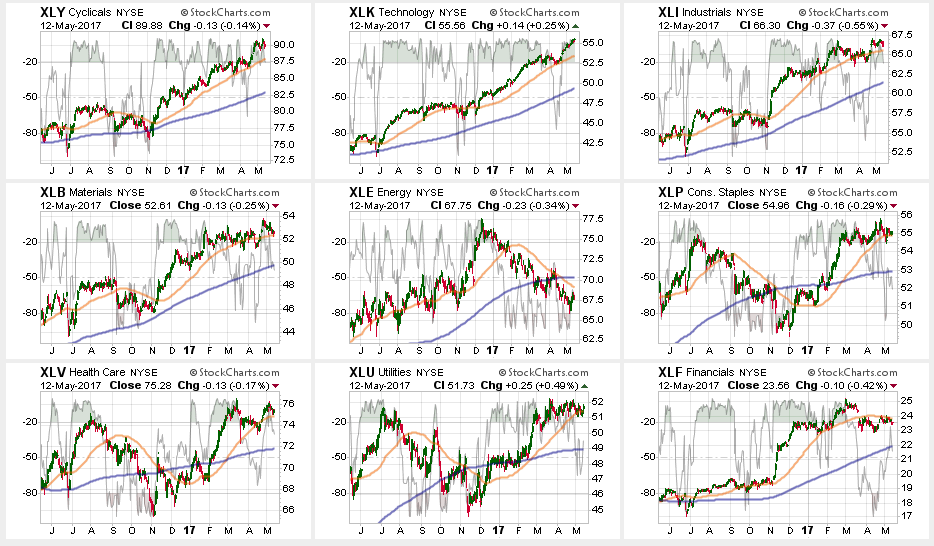
Outside of Technology, everything weakened. With the number of stocks leading the markets higher becoming much more narrow (Facebook Inc (NASDAQ:FB), Apple Inc (NASDAQ:AAPL), Amazon.com Inc (NASDAQ:AMZN), Netflix Inc (NASDAQ:NFLX), Alphabet Inc (NASDAQ:GOOGL) = #FAANG) the risk of a bigger correction has risen markedly.
Discretionary, Industrials, Materials, Staples, Healthcare and Utilities all weakened last week with the latter of the group flirting with respective 50-dmas. It will be important for these sectors to maintain their support levels as the underlying erosion of the market could well spread.
Energy continues to struggle after breaking its 50-dma and 200-dma. While energy had a bit of a bounce late last week on a move up in oil prices, the trend remains sorely negative. Energy has also triggered a major sector sell signal with the cross of the 50-dma below the 200-dma. Remain heavily underweight energy for the time being.
Note: Oil also failed at the $48/bbl resistance level last week. If oil prices retrace and break the previous lows there will likely be more damage to the energy sector. Risk is high currently.
Financials recently broke its 50-dma and has had two failed rally attempts keeping investors underweight the sector for now. With the sector pushing back towards overbought, a reversal here will likely coincide with further market weakness. Stops should be set at $23.
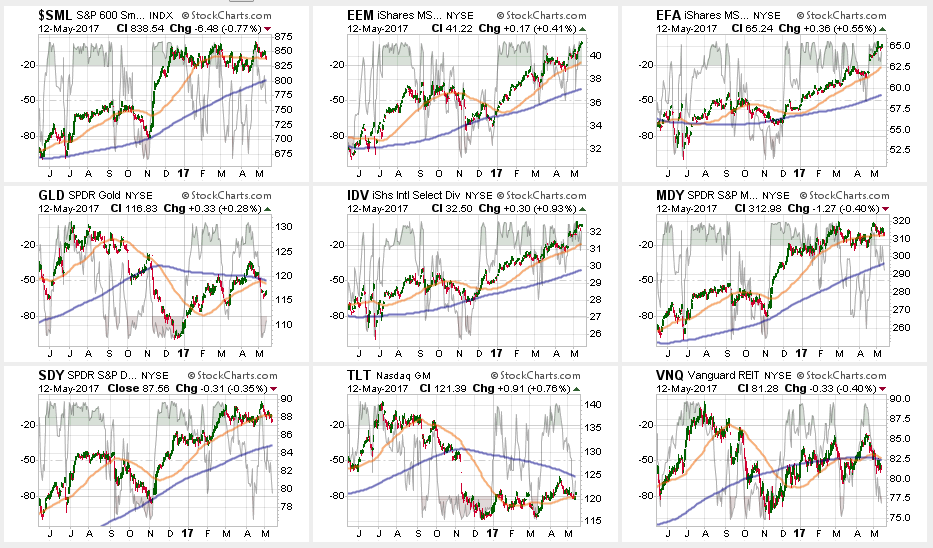
Small and Mid-Cap stocks lost steam last week with both flirting with the 50-dma’s after getting very overbought last week. As I noted last week:
“The question of sustainability of that strength will be answered this coming week. Continue to hold current positions (after recommending to take some profits recently) for now. A break of the multiple-bottom lows is now the ‘full stop.'”
The failure to maintain previous strength from puts support levels into close focus. Stops should be maintained at March lows.
Emerging Markets and International Stocks continued their strength following the French elections. There is a good bit of risk built into international stocks currently, but after having already taken profits a few weeks ago, we continue to hold these sectors for now with stop levels moved up to the recent lows.
Gold (GLD) remains out of favor. The short-term trading opportunity failed and long-term traders never got above $1300/oz to enter. With gold breaking the uptrend from the 2016 lows, there is no reason to own gold in portfolios currently. Furthermore, with the 50-dma still below the 200-dma, a “sell” signal remains. Gold needs to regain its footing above the 200-dma to become interesting.
S&P Dividend Stocks (via IDV and SDY), Bonds and REITs – a few weeks ago I recommended taking profits from these hedges as they had become extremely overbought. I stated then:
“If the broader markets can rally over the next week or two, simply due to a reflexive oversold condition, look for these sectors to pull back to provide a better entry point.”
This has been the case. Now we wait to see what happens next but these sectors are becoming more attractive.
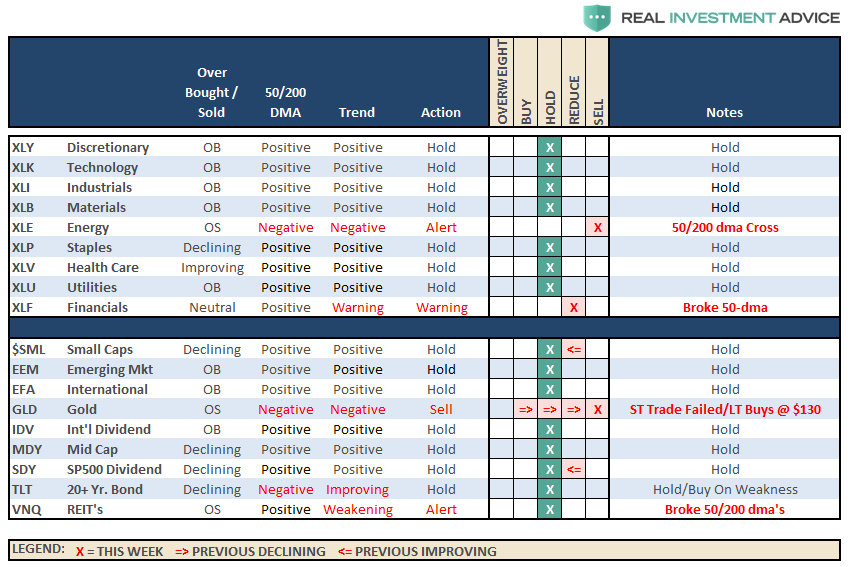
The table below shows thoughts on specific actions related to the current market environment.
(These are not recommendations or solicitations to take any action. This is for informational purposes only related to market extremes and contrarian positioning within portfolios. Use at your own risk and peril.)
Portfolio Update:
The bullish trend remains positive, which keeps us allocated on the long side of the market for now, but the weekly “sell signal” alert is not being dismissed.
However, the inability of the markets to convincingly breakout to new highs, despite the efforts of the #FANG stocks mentioned above, keeps us waiting for either a pullback to support, or a breakout to new highs, for an opportunity to put some of the recently harvested cash back to work on the long side.
For now, we wait to see what happens next, particularly as we move into the seasonally weaker months of the year. We are maintaining stops at recent support levels.
