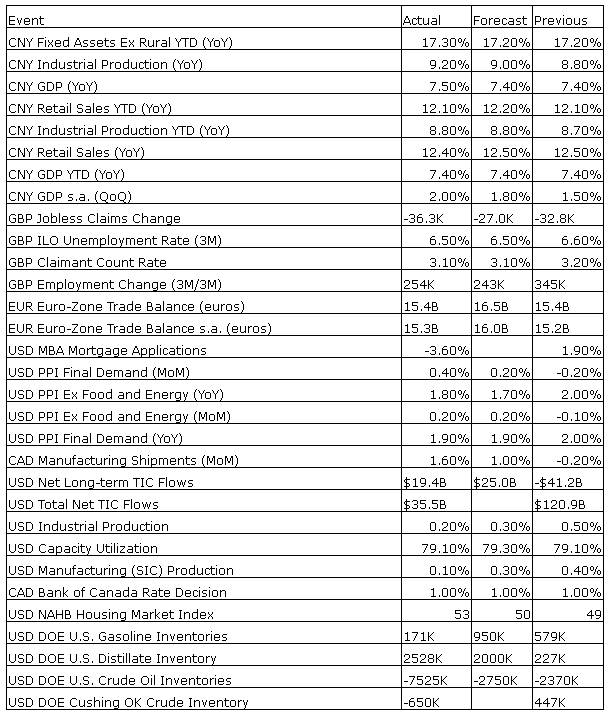
Upcoming US Events for Today:- Housing Starts for June will be released at 8:30am.The market expects 1.026M versus 1.001M previous.Building Permits are expected to show 1.038M versus 0.991M previous.
- Weekly Jobless Claims will be released at 8:30am. The market expects Initial Claims to show 310K versus 304K previous.
- Philadelphia Fed Survey for July will be released at 10:00am. The market expects 16.9 versus 17.8 previous.
Upcoming International Events for Today:
- Euro-Zone CPI for June will be released at 5:00am EST. The market expects a year-over-year increase of 0.5%, consistent with the previous report.
Recap of Yesterday’s Economic Events:
The Markets
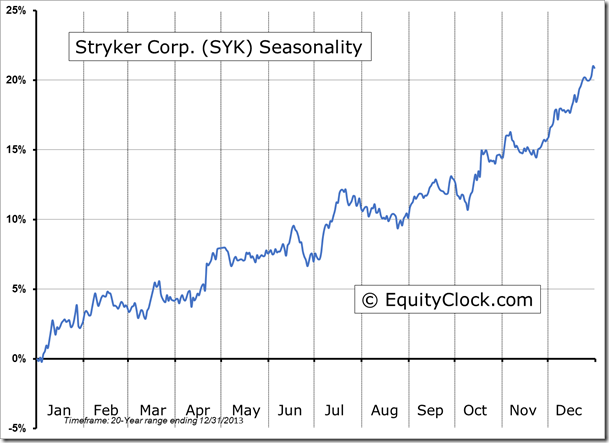
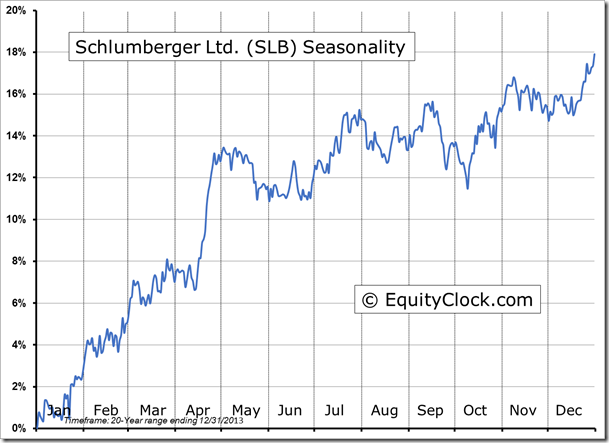
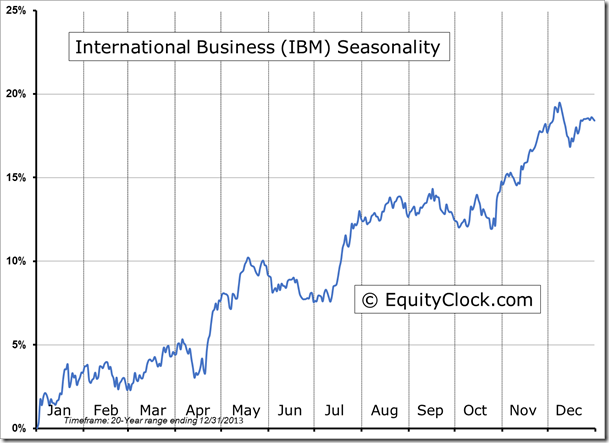
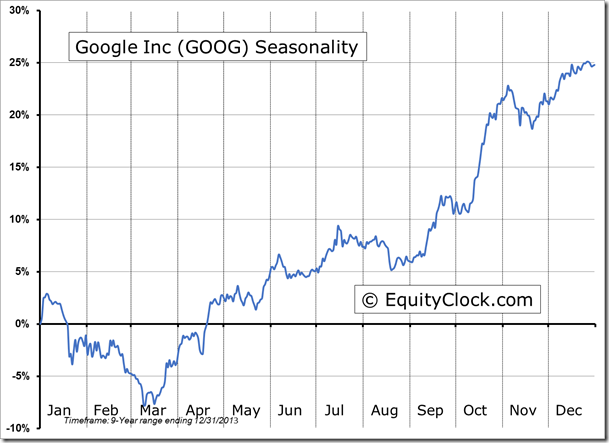
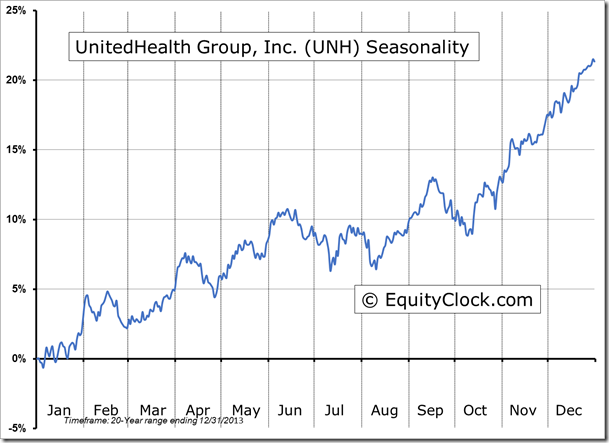
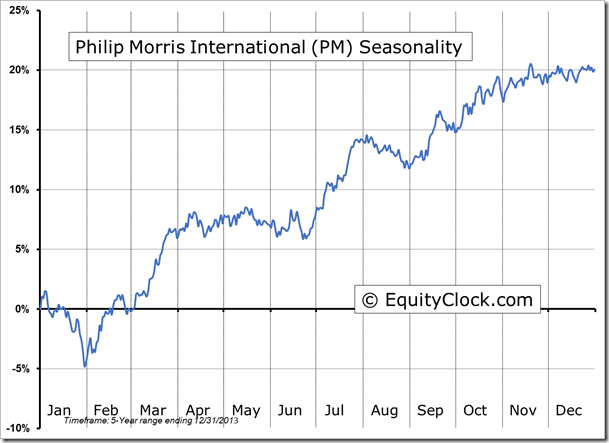
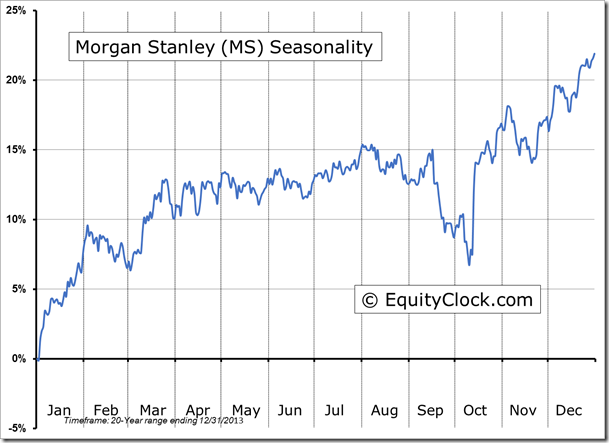
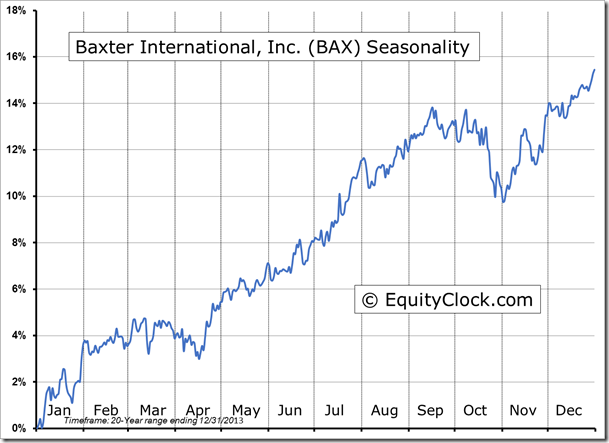
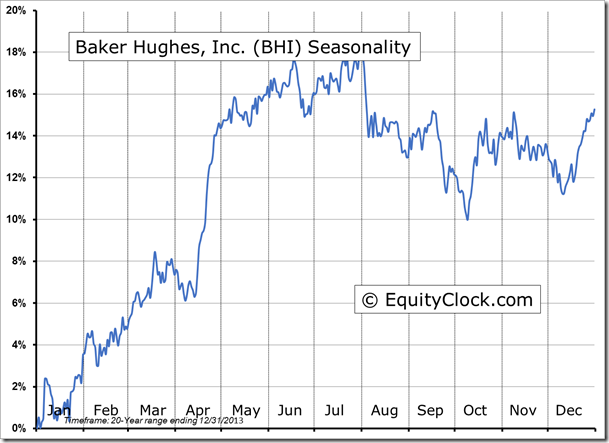
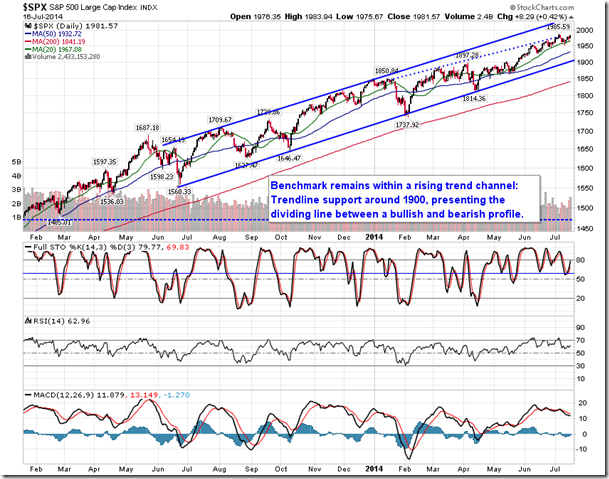
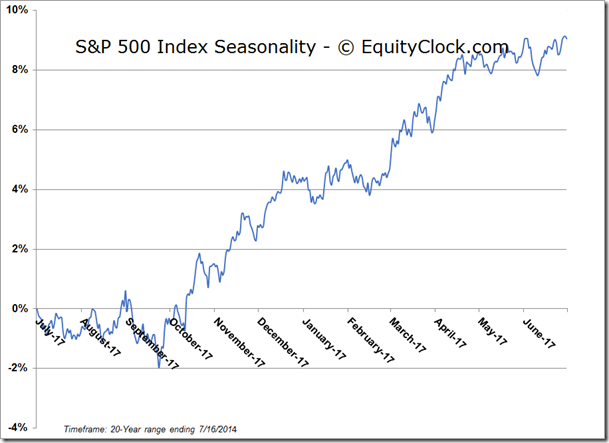
Stocks ended higher on Wednesday as investors continue to react positively to second quarter earnings reports. The Dow Jones Industrial Average once again charted a new all-time closing high while the S&P 500 ended just below the all-time peak. Earnings season picks up today with 79 companies reporting, including Philip Morris International Inc (NYSE:PM), UnitedHealth Group Incorporated (NYSE:UNH), Morgan Stanley (NYSE:MS), Baxter International Inc (NYSE:BAX), Baker Hughes Incorporated (NYSE:BHI), Google Inc (NASDAQ:GOOGL), International Business Machines (NYSE:IBM), Schlumberger NV (NYSE:SLB), and Stryker Corporation (NYSE:SYK), providing a broad glimpse of the strength of corporate income statements across a variety of sectors. With a wide variety of earnings reports to be released today, we’ve reached the point where investors should have obtained enough information to make equity allocation decisions for the rest of the quarter, and perhaps the rest of the year. For this reason, broad equity markets reach an inflection point on July 17th, on average, following which gains and losses are equally common through to the next earnings season in October. Despite the equal tendency for gains and losses over the next three months, losses have historically overwhelmed the gains, resulting in an average loss for US equity benchmarks, such as the S&P 500 Index. The days and weeks ahead will be critical for the trend of the equity market through the remainder of the third quarter.
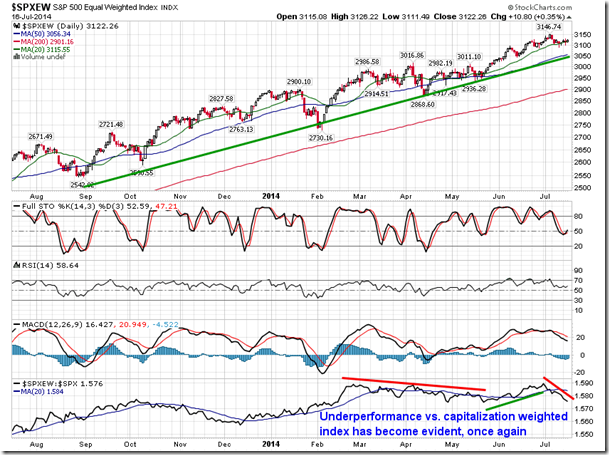
Equity benchmarks in the US have recorded healthy gains since mid-May, fuelled by broad participation across a number of sectors as economic data has strengthened following the winter. Since May 16th, the S&P 500 Index is up 5.92%, the Dow Jones Industrial Average is up 4.20%, and the NASDAQ Composite is up 8.77%. With broad market participation from mid-May through to the start of July, the S&P 500 Equally Weighted Index outperformed the Capitalization Weighted Index, breaking a declining relative trend for the equally weighted benchmark that spanned from February through to May. The equally weighted benchmark has started to show signs of underperformance, yet again, providing some concern as to the strength of the broad market. This can be a sign of waning equity market strength, typically a leading indication of weakness ahead.
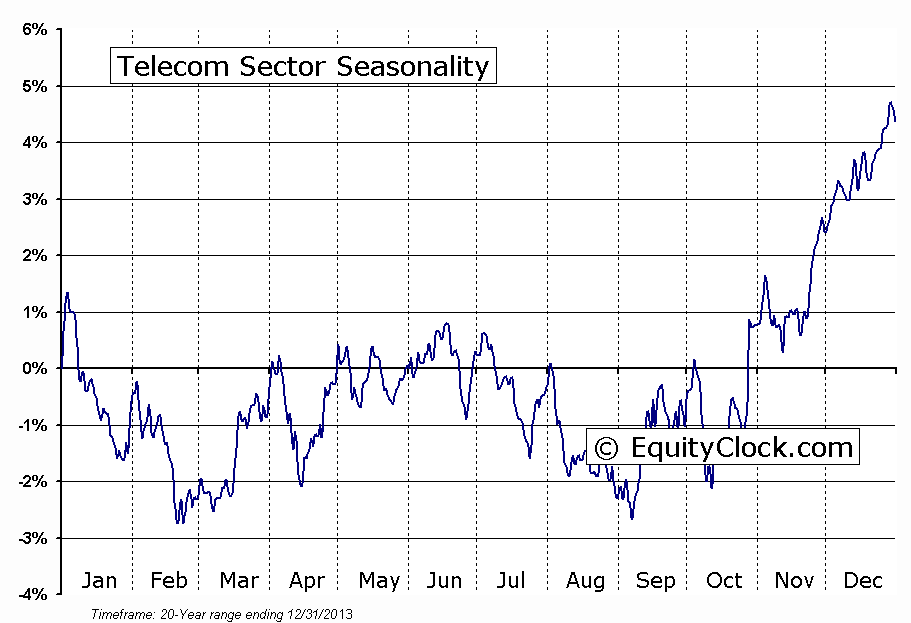
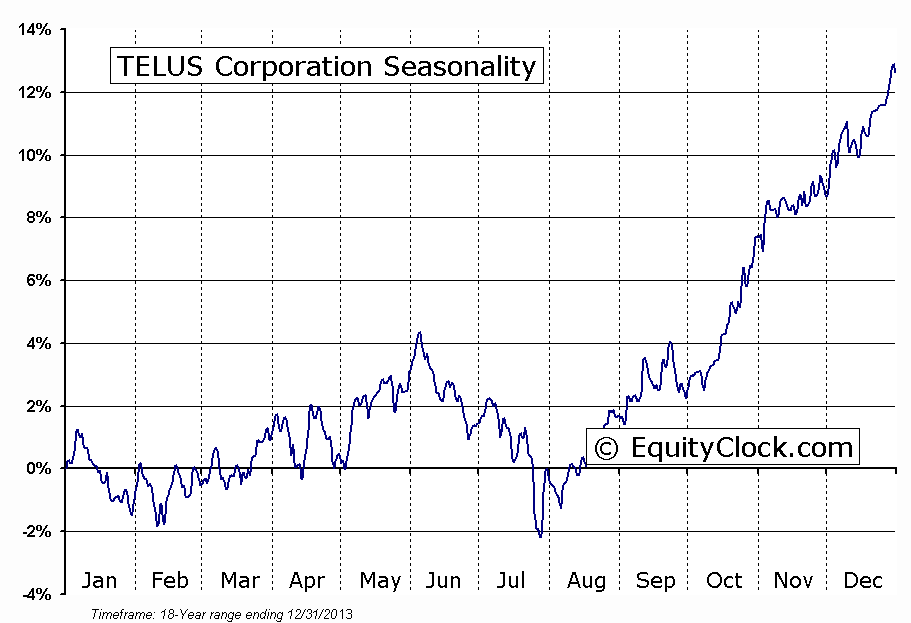
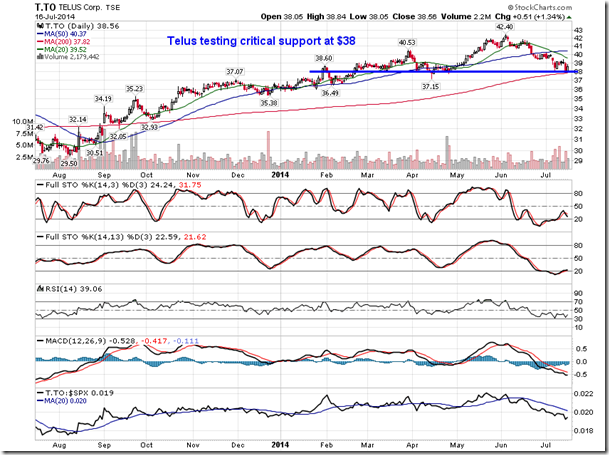
Looking forward to the back half of the year, one of the sectors that tends to perform well is the Telecommunications sector. The sector has averaged gains from the start of September through to the end of December, outperforming the S&P 500 Index over the period. Average gain for the sector over the four months is 7.5% during a period when volatility often peaks. Although the broad sector kicks off its period of seasonal strength beginning in approximately six weeks, on average, there are individual stocks that begin this seasonal run early. One of these stocks is Telus, which has averaged seasonal gains between the end of July and the end of December. Average return for the telecommunications company over the period exceeds 14%, outperforming the S&P 500 Index by over 10%. Telus is presently testing a critical level of support around $38, representing horizontal support, as well as the 200-day moving average. Momentum indicators are showing early signs of curling higher following the recent selloff, suggesting a possible low ahead of the period of seasonal strength. Telecommunication stocks typically offer appealing dividend yields, allowing the sector to outperform during periods of volatility, as is typical during August and September.
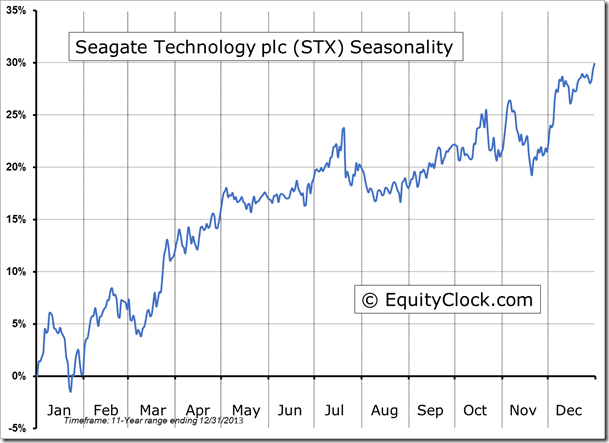
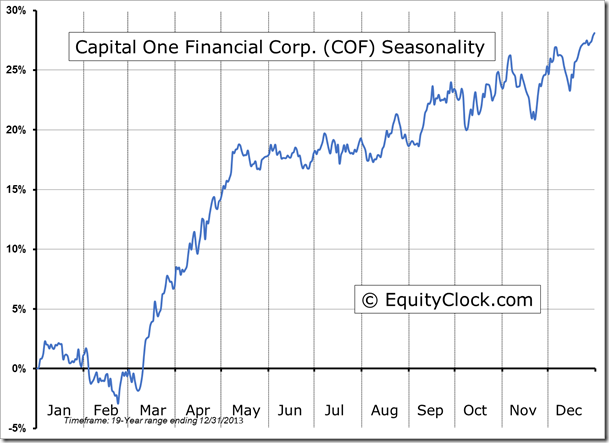
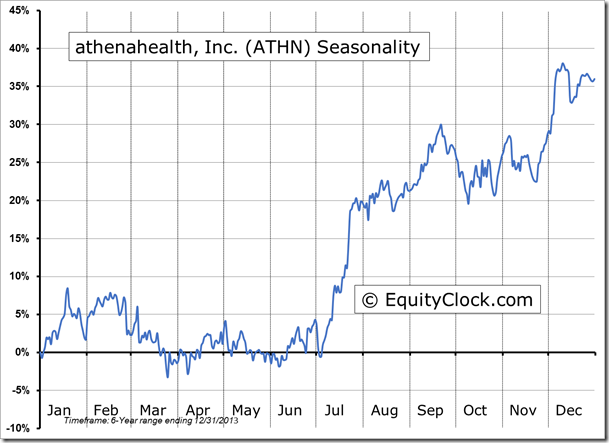
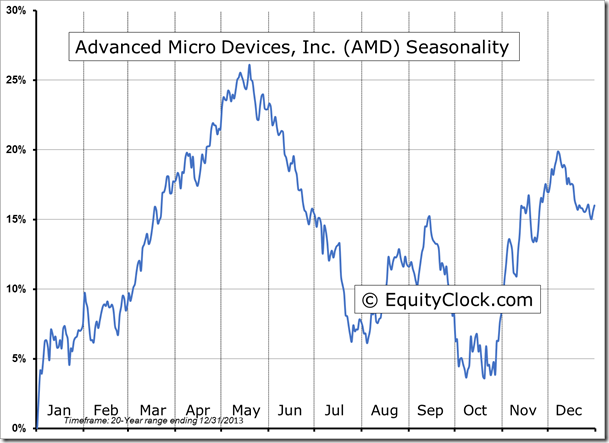
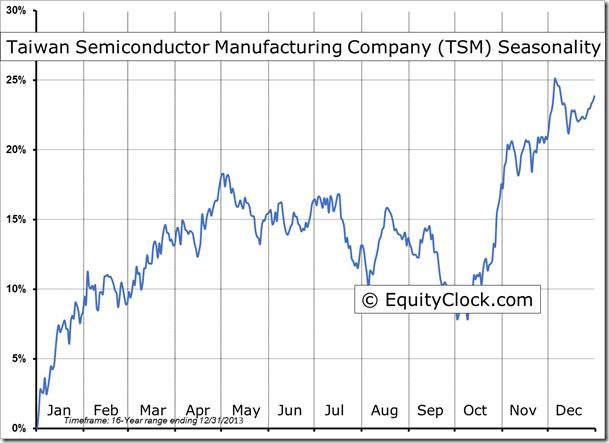
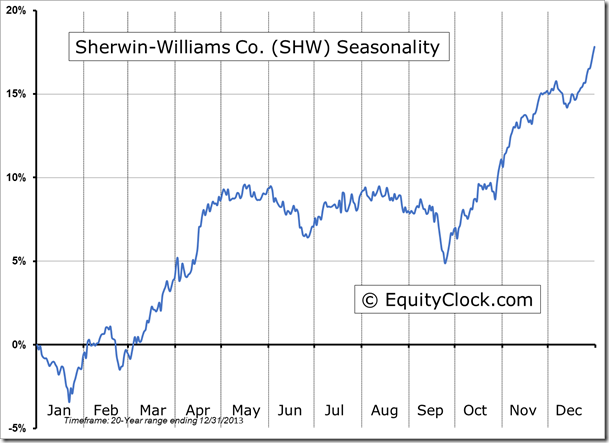
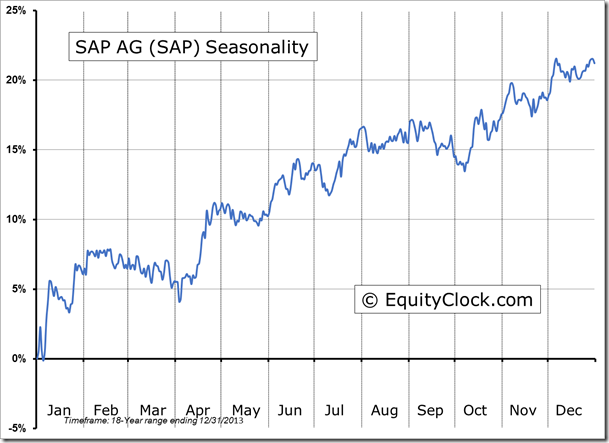
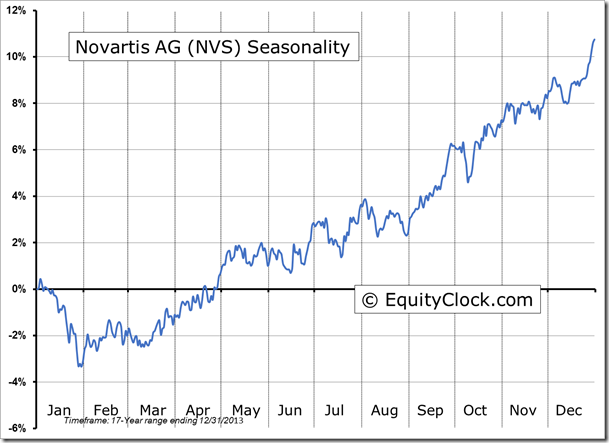
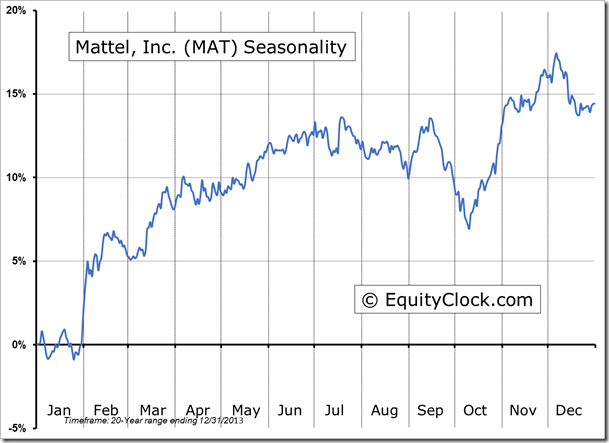
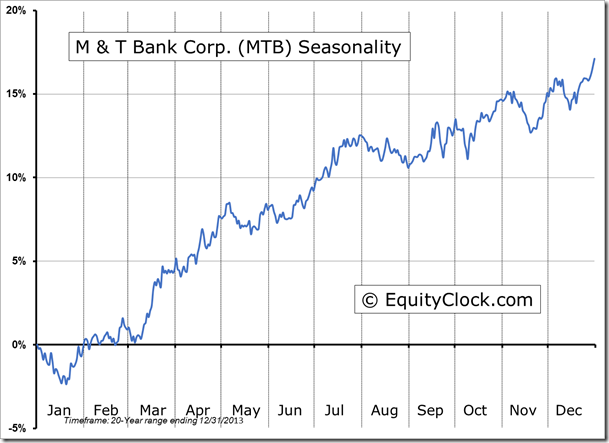
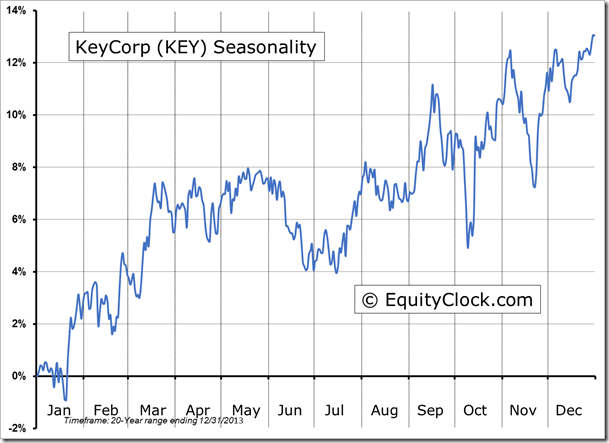
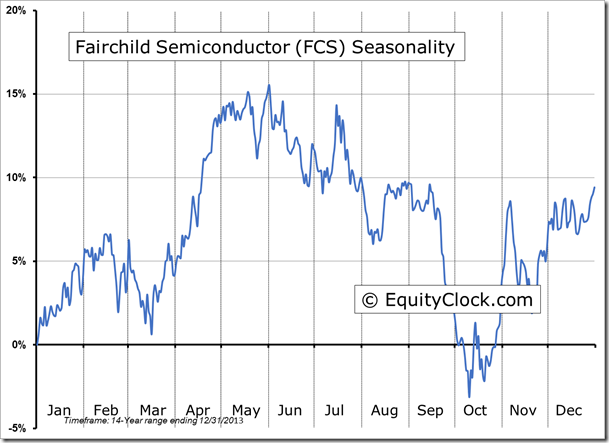
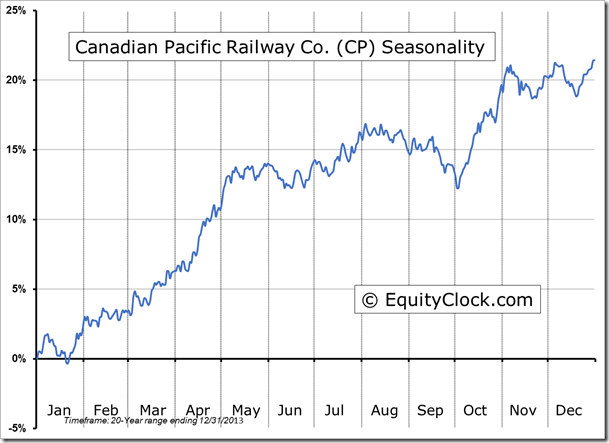
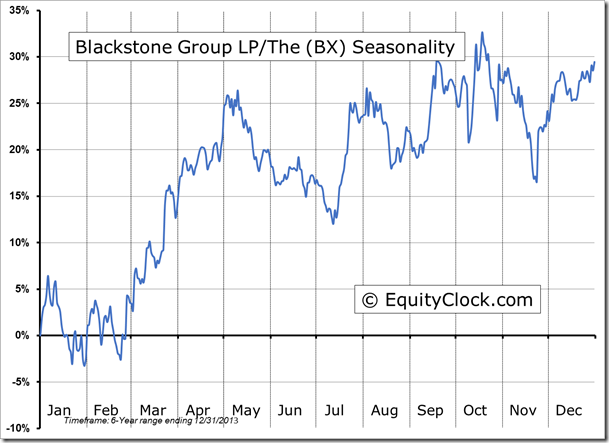
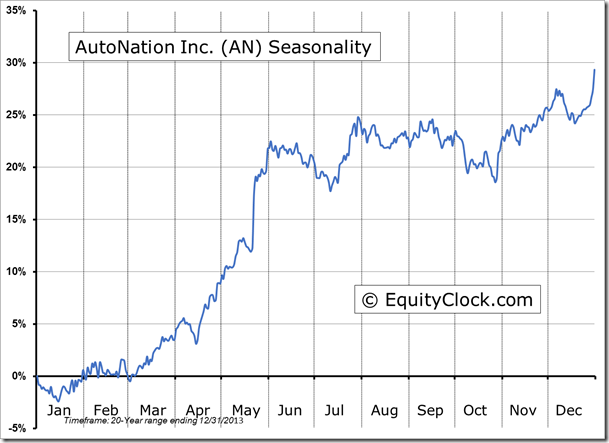
Seasonal charts of companies reporting earnings today:
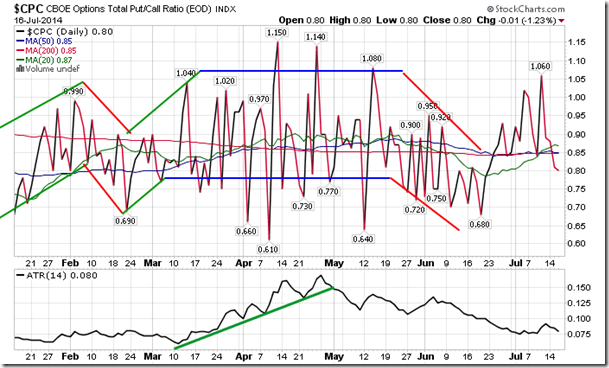
Sentiment on Wednesday, as gauged by the put-call ratio, ended bullish at 0.80.
S&P 500 Index
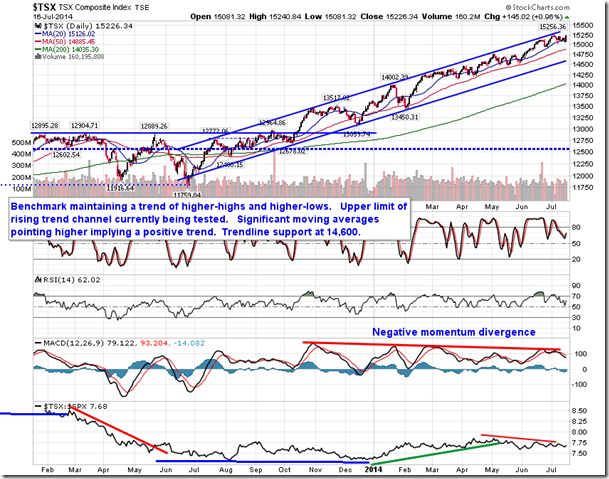
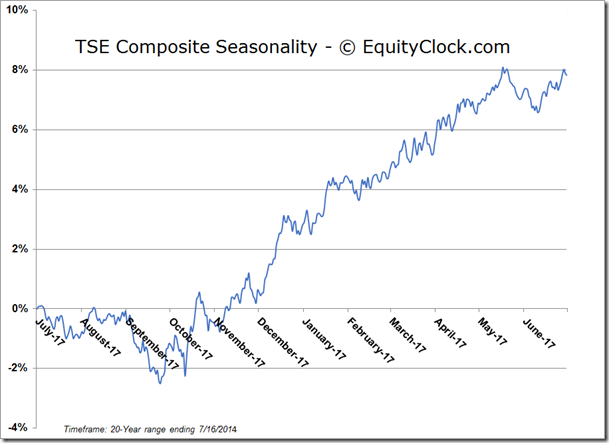
TSE Composite
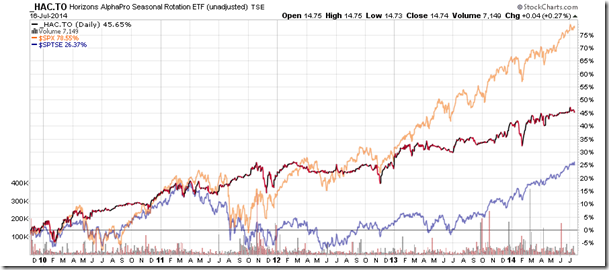
Horizons Seasonal Rotation ETF (TSX:HAC)
- Closing Market Value: $14.74 (up 0.27%)
- Closing NAV/Unit: $14.73 (up 0.21%)
Performance*
| 2014 Year-to-Date | Since Inception (Nov 19, 2009) | |
| HAC.TO | 3.01% | 47.3% |
* performance calculated on Closing NAV/Unit as provided by custodian

