The third quarter just ended... and it wasn’t pretty.
In all, S&P 500 companies are expected to report a 4.2% drop in earnings for the quarter.
The NASDAQ is down 7.4% and the Dow is down 7.6%. Many analysts are calling the previous 90 days the worst three-month period for stocks since 2011. Everything was down, down, down...
But will it stay that way?
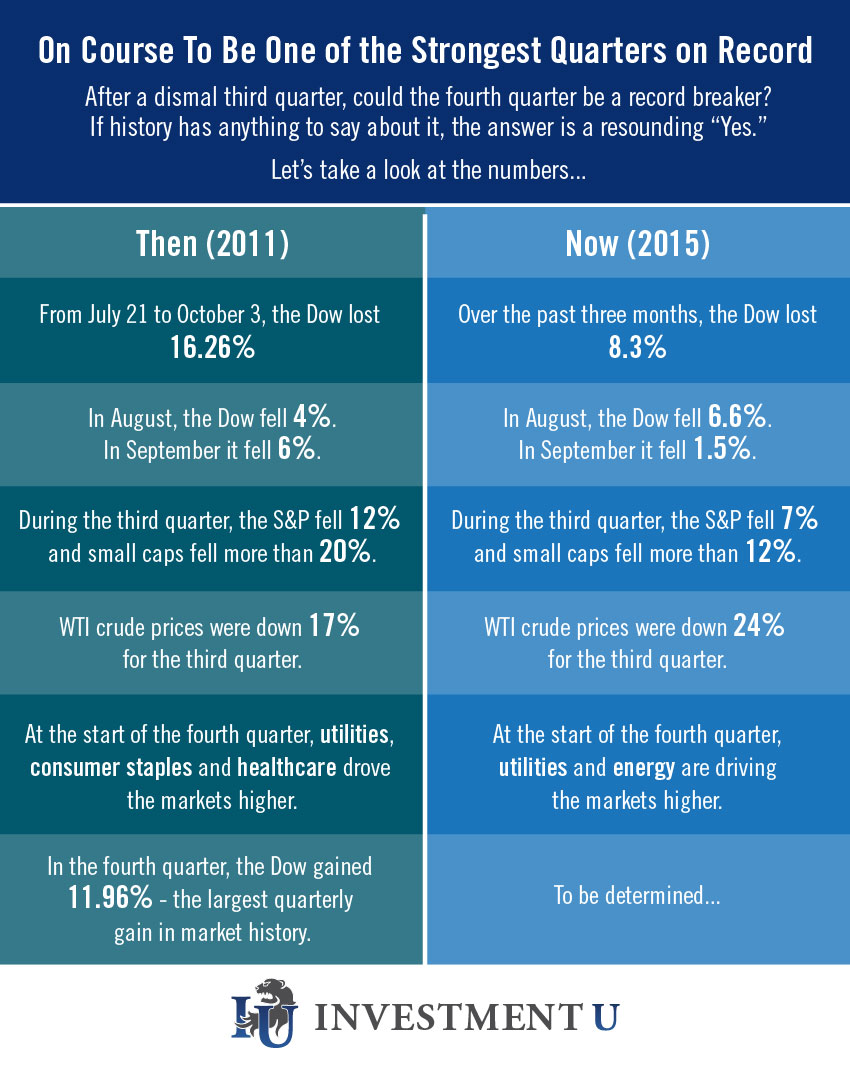
As you can see in the infographic above, there are a lot of similarities between what’s happening in the market today and what was happening around this time in 2011...
Just before the Dow logged the largest quarterly gain in market history.
As Matthew Carr pointed out in a recent column, four years ago we were grappling with concerns over Greek debt... gridlock in Washington... a slowdown in hiring... not to mention rampant volatility in stocks.
In other words, the situation was virtually identical to what we’re seeing today. And yet, in the fourth quarter of 2011, the Dow swiftly rocketed 11.96%.
It could happen again, too. Just consider... only two weeks into the fourth quarter, the Dow, Nasdaq and S&P 500 are already up more than 5%.
Where are these gains coming from? According to Matt, the utilities and energy sectors are driving much of the action (we covered the latter in last week’s chart). But he also sees increasing strength in consumer discretionary and technology spending.
Will the Dow break another market record? Only time will tell. But in Matt’s words, “This is the same spot we found ourselves in back in 2011, which means we could be in store for another record-breaking quarterly gain in the months ahead.”
Of course, there’s still a long way to go before the fourth quarter closes. But if history repeats, what’s been a tough year for many investors could end on a high note.
