Investing.com’s stocks of the week
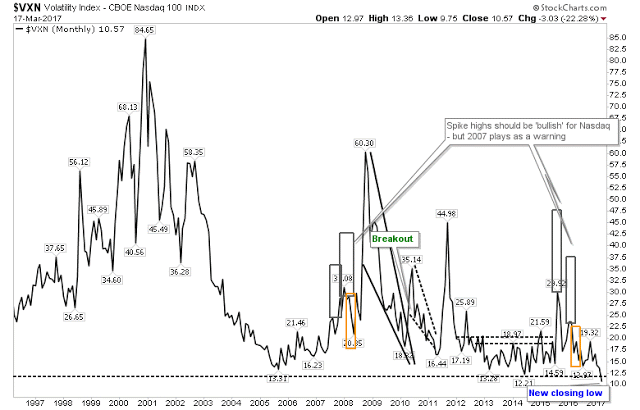
While the NASDAQ has reached new highs, the VXN has pushed to lows not seen in over 20 years. This complacency makes it difficult to know how long this lack of fear can go on. The one caveat is that as a monthly chart and any uptick in volatility could take years before it tops out; how will Trump trigger this collapse?
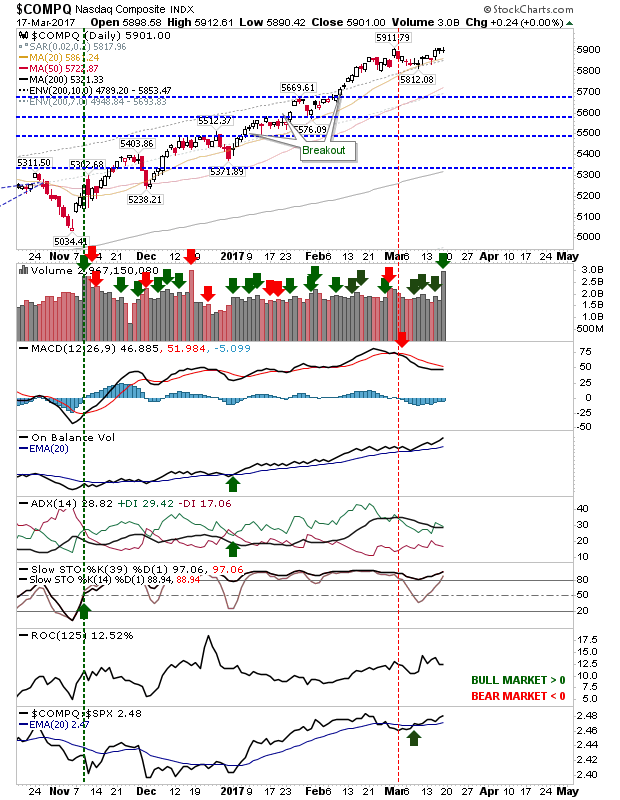
The NASDAQ price chart isn't offering any clear signs of weakness. Friday's churn on higher volume marked options expiration, but could also mark a switch from long-term shareholders to short term, weak-hand breakout traders. If the index fails to clear 5,912 and instead gives up a hundred points to undercut 5,812 then profit taking could kick in and trigger the long awaited rise in volatility/fear - which may be the start of the next cyclical sell-off (lasting 6 months+).
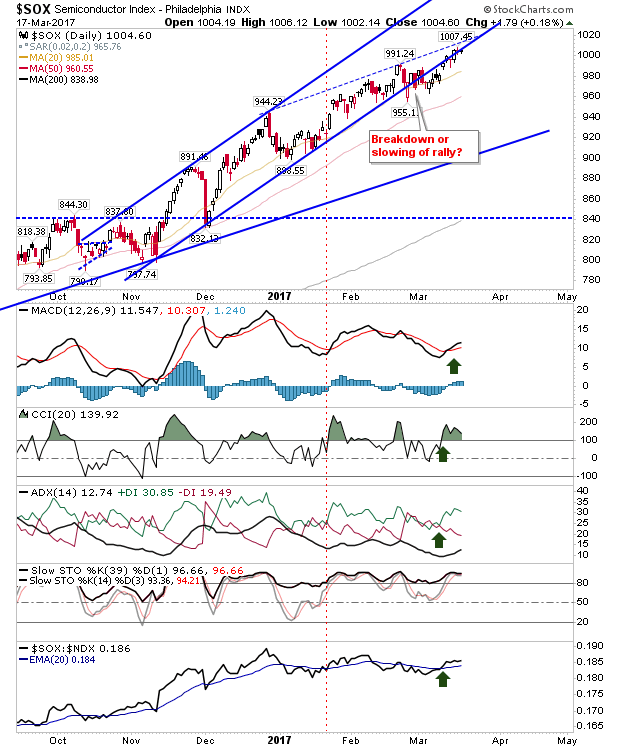
The Semiconductor Index is approaching the convergence point between rising channel support and resistance connecting the December and February swing highs. Technicals are all positive, so there isn't any leading indication to suggest the illustrated hashed line will play as resistance.
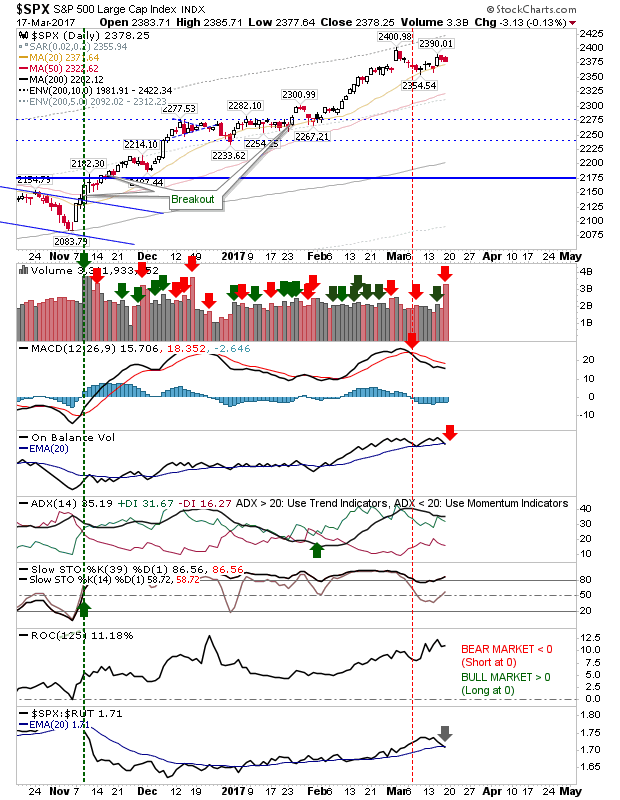
The S&P experienced the higher volume as selling, but like the NASDAQ there wasn't any great price change to go with the volume. This came with a 'sell' in On-Balance-Volume.
The Russell 2000 had the best of the action, continuing to attract value buyers. The index is close to a new MACD trigger 'buy' and a relative out-performance leadership gain against the NASDAQ.
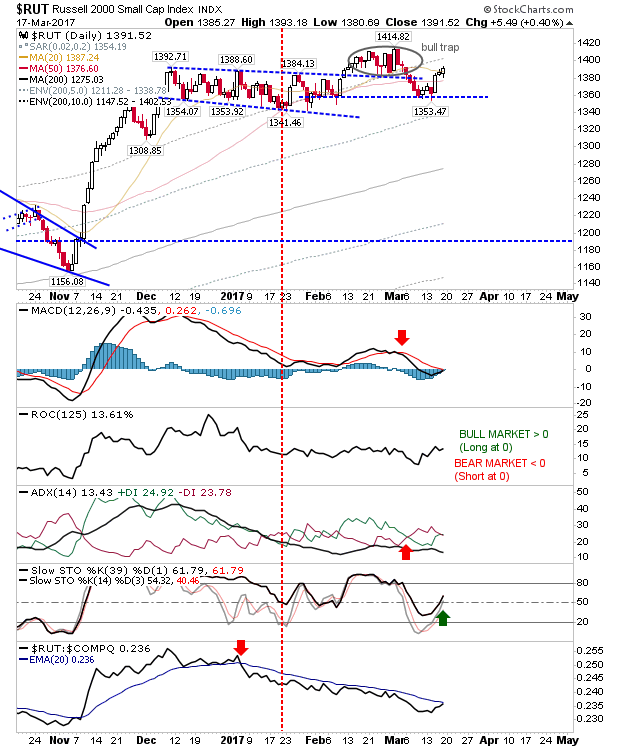
For Monday, bulls can look for a breakout in the NASDAQ and continued value buying in the Russell 2000. Shorts should watch the S&P, after two days of selling it is the most vulnerable to a third.
If this leads to a loss of 2,354 then selling could spread to other indices. Short terms are still running in bulls' favor, so the path of least resistance is higher.
