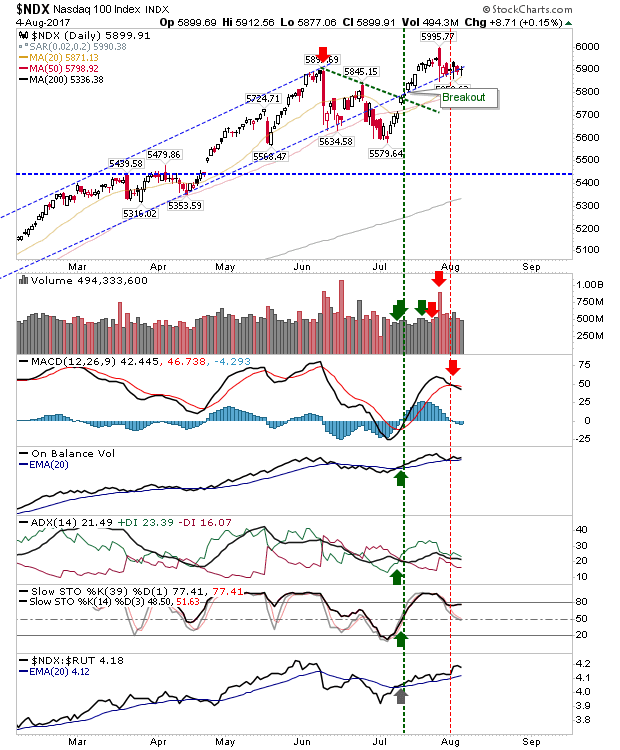
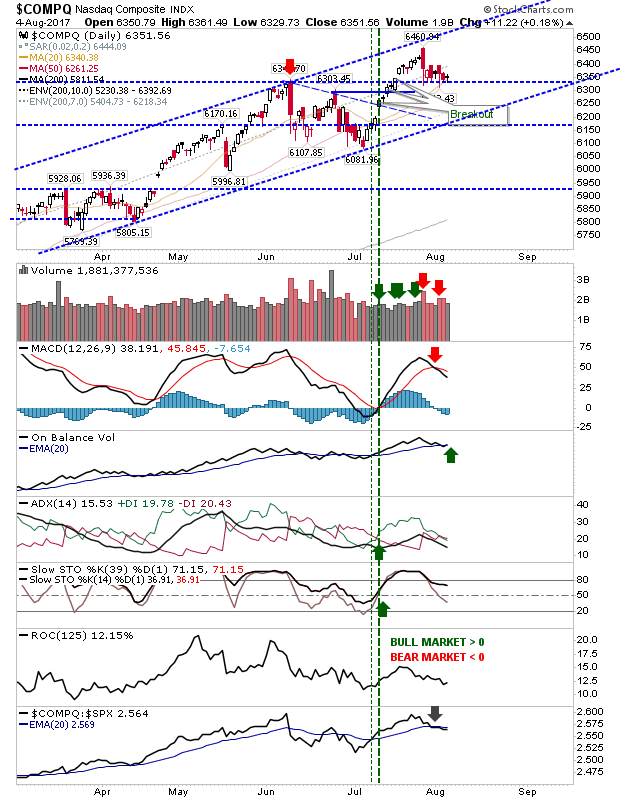
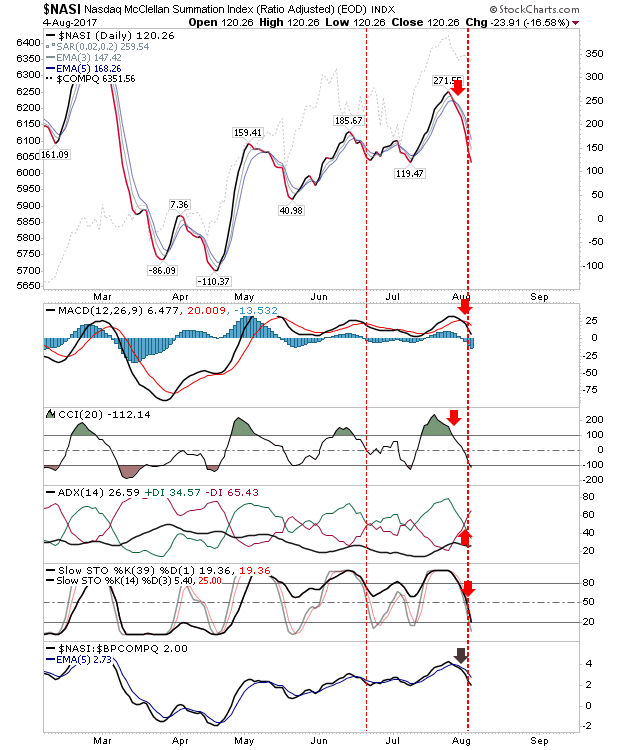
The NASDAQ and NASDAQ 100 were able to finish the week on support but breadth metrics took a nose dive lower. Both the NASDAQ and NASDAQ 100 only have MACD trigger 'sells' to mark weakness.
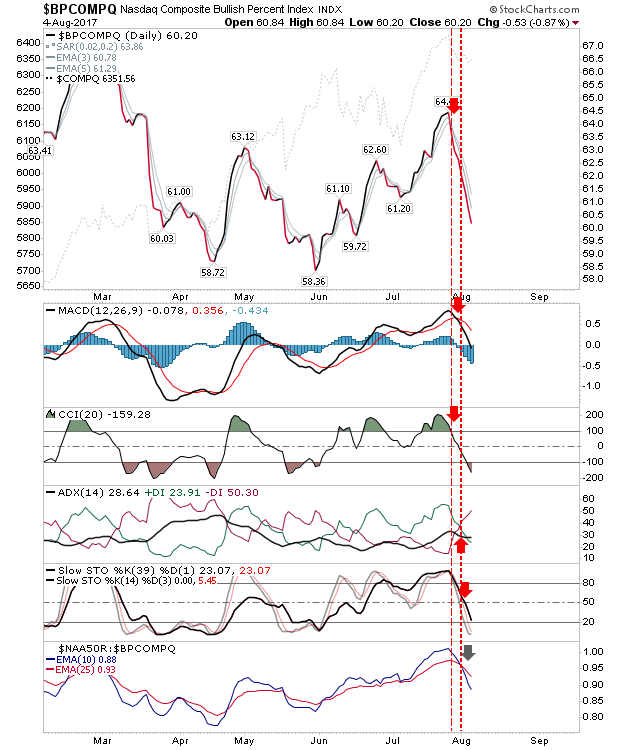
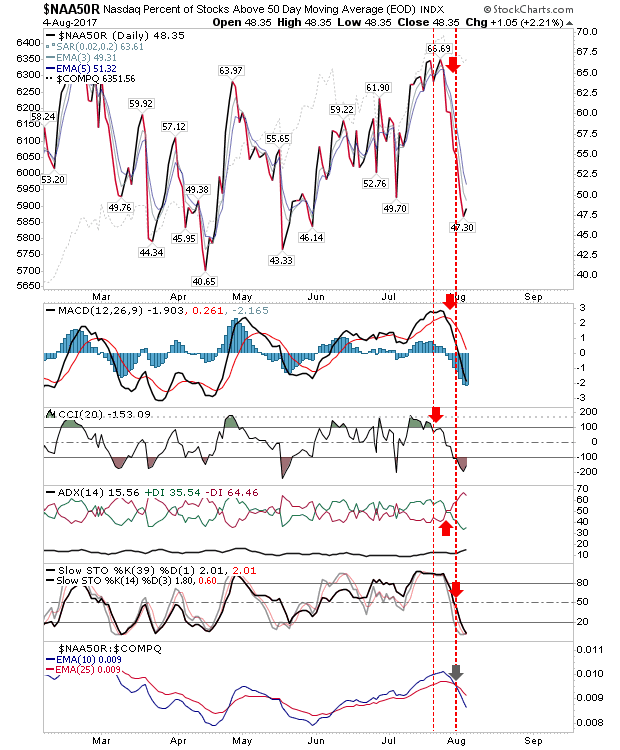
But it's Tech breadth metrics which have been on the slide since the end of July. Supporting technical indicators confirm the weakness for Bullish Percents, Percentage of Stocks above the 50-day MA and Summation Index.
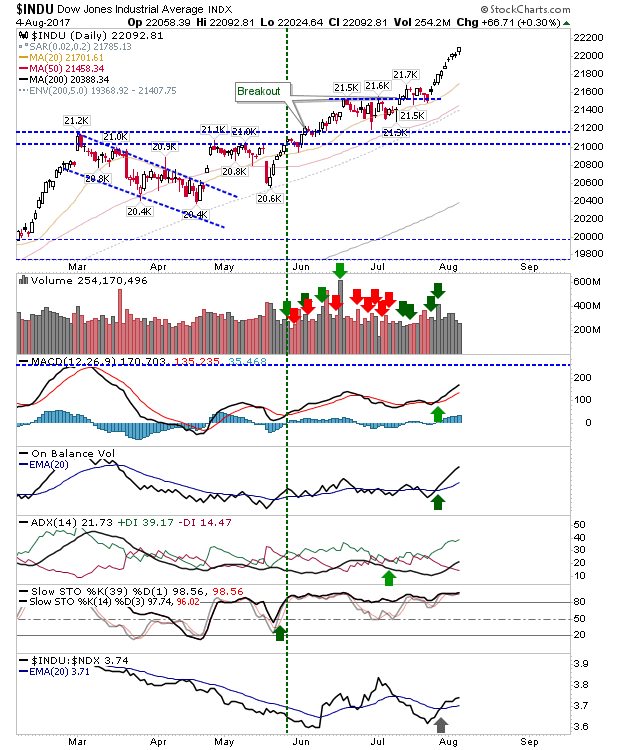
The Dow Jones Index is apparently ignoring weakness in other indices. How long can this last?
The Russell 2000 attempted a recovery just above the last swing low of 1,398. Day traders may make a rally to 1,420 but watch for supply as it looks to challenge the recent swing high.
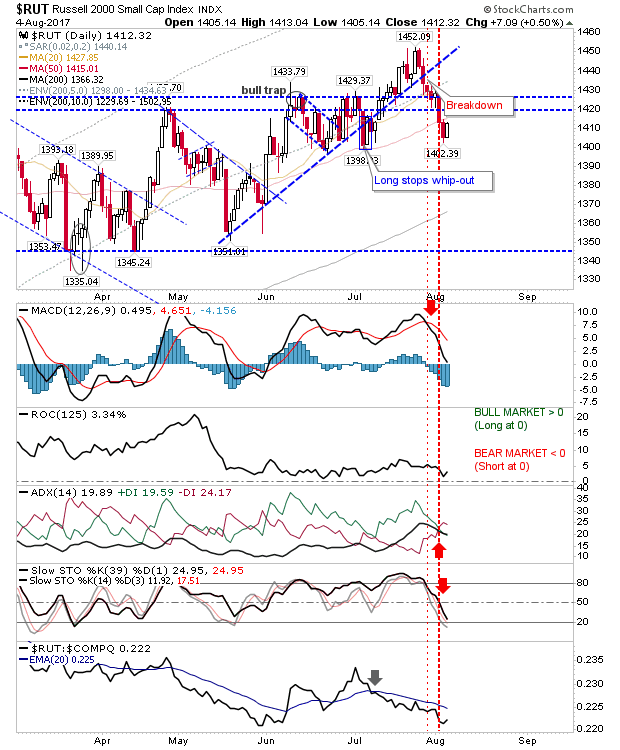
For Monday look for support breaks in Tech averages in line with breadth metrics. Bulls can look for a recovery bounce in the Russell 2000. Dow Jones longs can hold until the previous day's low is breached.
