⭐ Start off 2025 with a powerful boost to your portfolio: January’s freshest AI-picked stocksUnlock stocks

MSCI World Index At Critical Support; Further Weakness Could Be Ahead

Published 03/26/2018, 12:08 AM
Updated 07/09/2023, 06:31 AM
NDX
-
US500
-
US2000
-
VIX
-
RVX
-
VXN
-
MIWD00000PUS
-

I last wrote about the MSCI World Index in my post of early February as one of the volatility gauges to monitor for clues in equity direction. At that time, its price was 2050.90 and I mentioned that 2032.74 was a critical major support level to watch.

Since then it has dropped further and closed just above that level on Friday, as shown on the following weekly chart.

I'd reiterate that a drop and hold below that level could send all world markets into a tailspin. The dramatic and swift plunge of the momentum indicator (which began in late January) is hinting of further weakness ahead on this timeframe, unless we see a swifter and convincing (sustainable) bounce soon. In the meantime, look for wild swings in this index, particularly this coming week, and beyond.
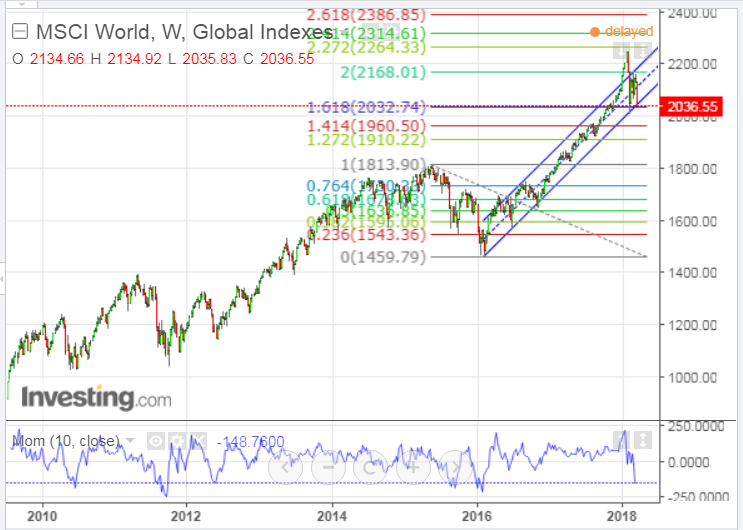
MSCI World Index Weekly 2010-2018

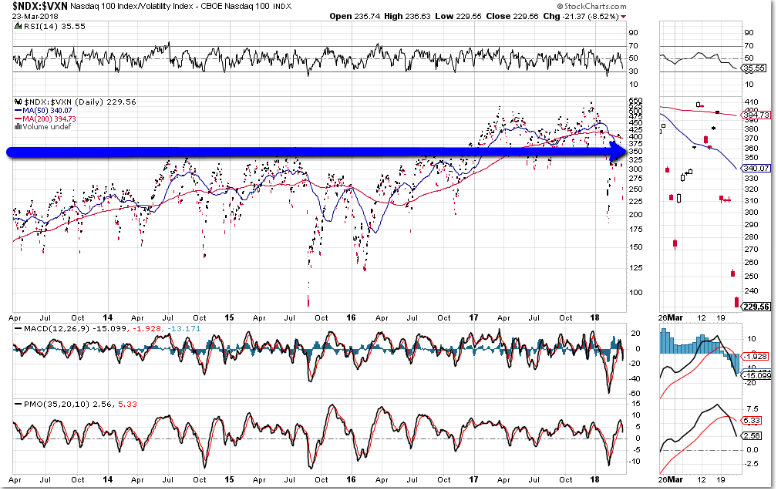
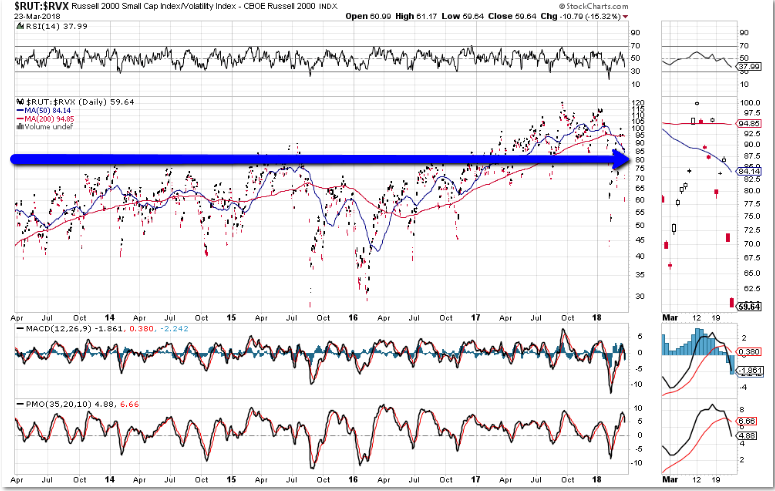
Also, as a follow-up to my post of early March, I'd just include an update on the following three equity volatility daily ratio charts (SPX:VIX, NDX:VXN, and RUT/RVX).

Once again, all three ratios have fallen below their critical support levels of 200, 350, and 80, respectively, are back below both their 50 and 200-day moving averages, and are still trading under the bearish influence of a moving average Death Cross formation. Furthermore, a new "SELL" signal has formed on the RSI, MACD, and PMO indicators...hinting of further weakness ahead.

As is the case of the MSCI World Index, no doubt, we'll also see some wild swings made this coming week and beyond on these ratios. Volatility will remain elevated until:

  • all three ratios, not only climb back above, but also hold above, what is once again, their major resistance levels,
  • all three technical indicators reverse and new "BUY" signals are formed, and
  • the bearish Death Cross is reversed to a bullish Golden Cross.
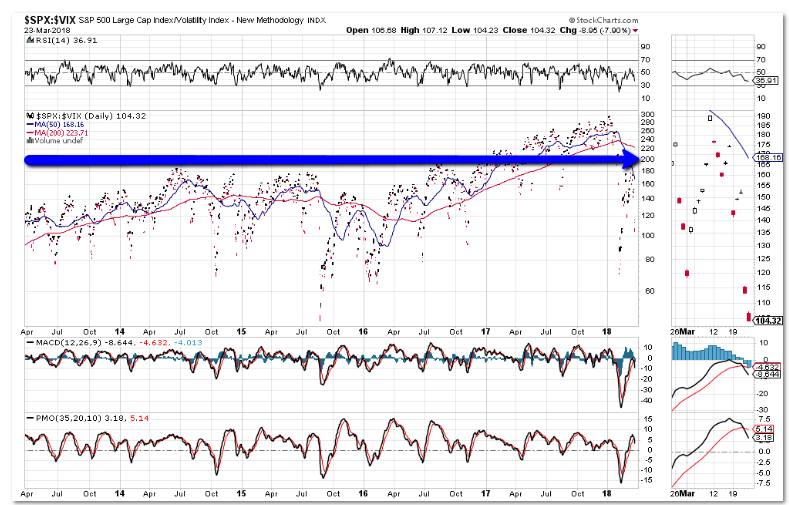
SPX - VIX Daily Chart
NDX-VXN Daily Chart
RUT-RVX Daily Chart

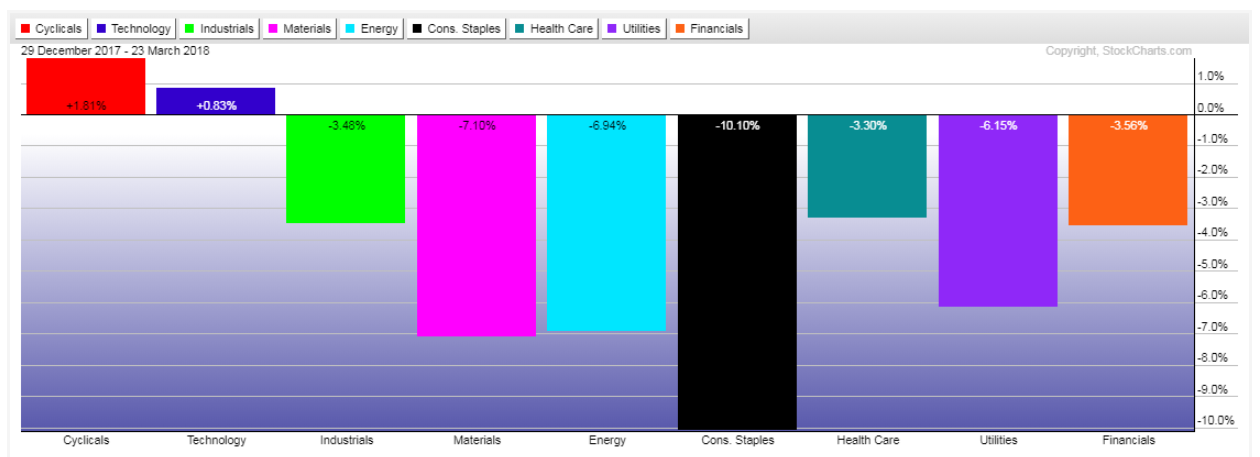
Finally, most of the Major U.S. Indices and Major Sectors are under water in terms of their losses made, year-to-date, as shown on the following graphs.
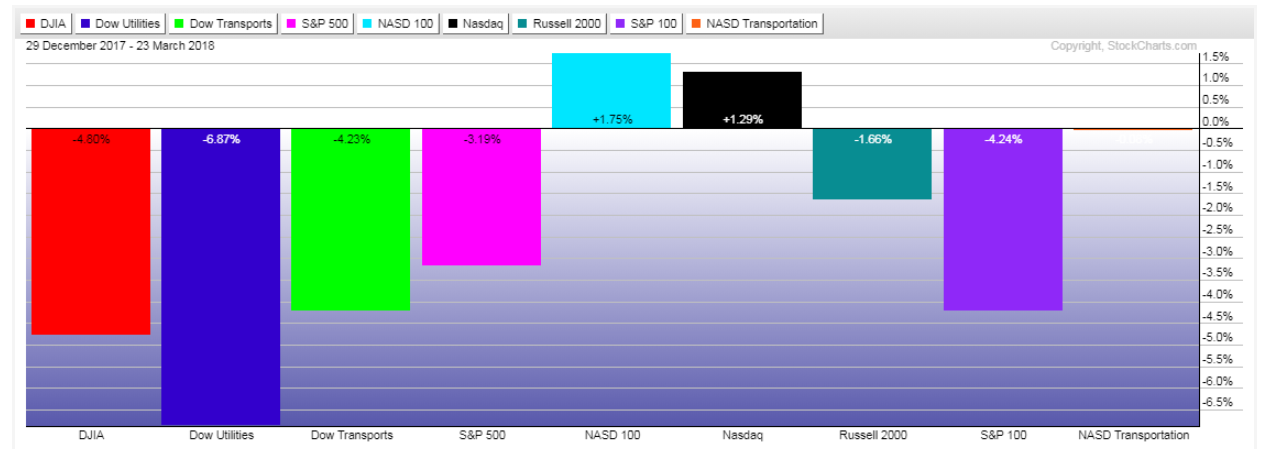
Major U.S. Indices
Major Sectors

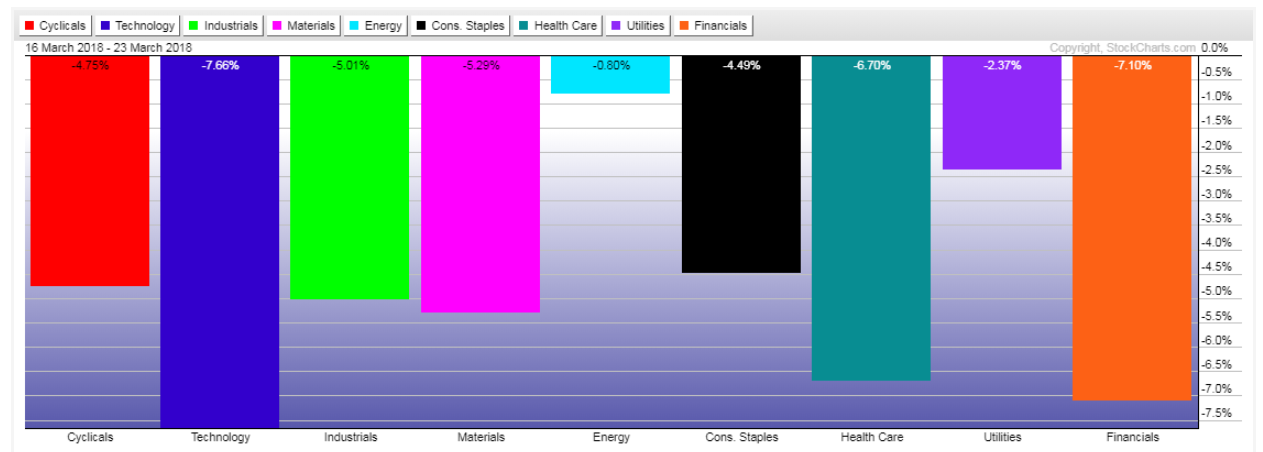
The large-scale selloff hit all of the Major Indices and Major Sectors this past week, as shown on the following one week graphs.

Watch for any meaningful rotation into any of these in the coming week(s)...otherwise, I think equities are in for a rough ride.
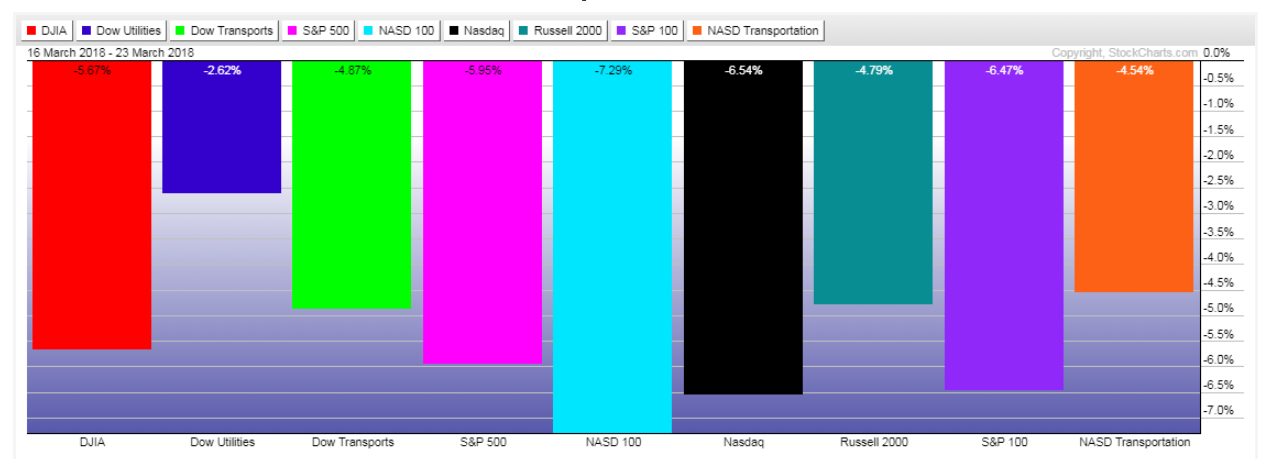
Major Indices
Major Sectors

Latest comments

Loading next article…
Risk Disclosure: Trading in financial instruments and/or cryptocurrencies involves high risks including the risk of losing some, or all, of your investment amount, and may not be suitable for all investors. Prices of cryptocurrencies are extremely volatile and may be affected by external factors such as financial, regulatory or political events. Trading on margin increases the financial risks.
Before deciding to trade in financial instrument or cryptocurrencies you should be fully informed of the risks and costs associated with trading the financial markets, carefully consider your investment objectives, level of experience, and risk appetite, and seek professional advice where needed.
Fusion Media would like to remind you that the data contained in this website is not necessarily real-time nor accurate. The data and prices on the website are not necessarily provided by any market or exchange, but may be provided by market makers, and so prices may not be accurate and may differ from the actual price at any given market, meaning prices are indicative and not appropriate for trading purposes. Fusion Media and any provider of the data contained in this website will not accept liability for any loss or damage as a result of your trading, or your reliance on the information contained within this website.
It is prohibited to use, store, reproduce, display, modify, transmit or distribute the data contained in this website without the explicit prior written permission of Fusion Media and/or the data provider. All intellectual property rights are reserved by the providers and/or the exchange providing the data contained in this website.
Fusion Media may be compensated by the advertisers that appear on the website, based on your interaction with the advertisements or advertisers.
© 2007-2025 - Fusion Media Limited. All Rights Reserved.