As mentioned in my 2018 Market Forecast, I think that volatility will remain elevated for much of 2018 (although to what extent will, no doubt, vary) in this evolving environment where Central Bankers are tightening monetary stimulus measures they deployed after the 2008/09 financial crisis.
As I posted in early February, near-term major support on the SPX lies somewhere in between 2525 and 2485. The upper edge of that zone was almost hit on Friday as it reached 2532, before snapping back to close the day higher.
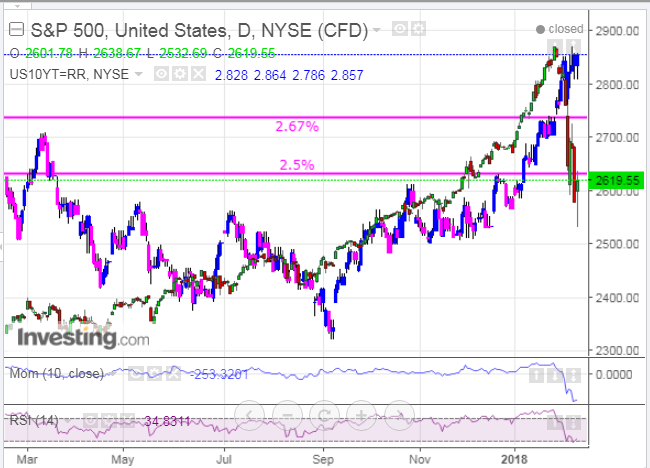
The following daily comparison chart shows that 10-YR rates have held near their recent highs during the recent correction of the SPX. Whether rates continue to hold or push higher on any recovery in equities, and whether that may materially impact the extent of such a recovery, remains to be seen. As long as 10-YRT remains above, firstly, 2.67% and, ultimately, 2.5%, then equities will remain vulnerable to more wild swings and weakness.
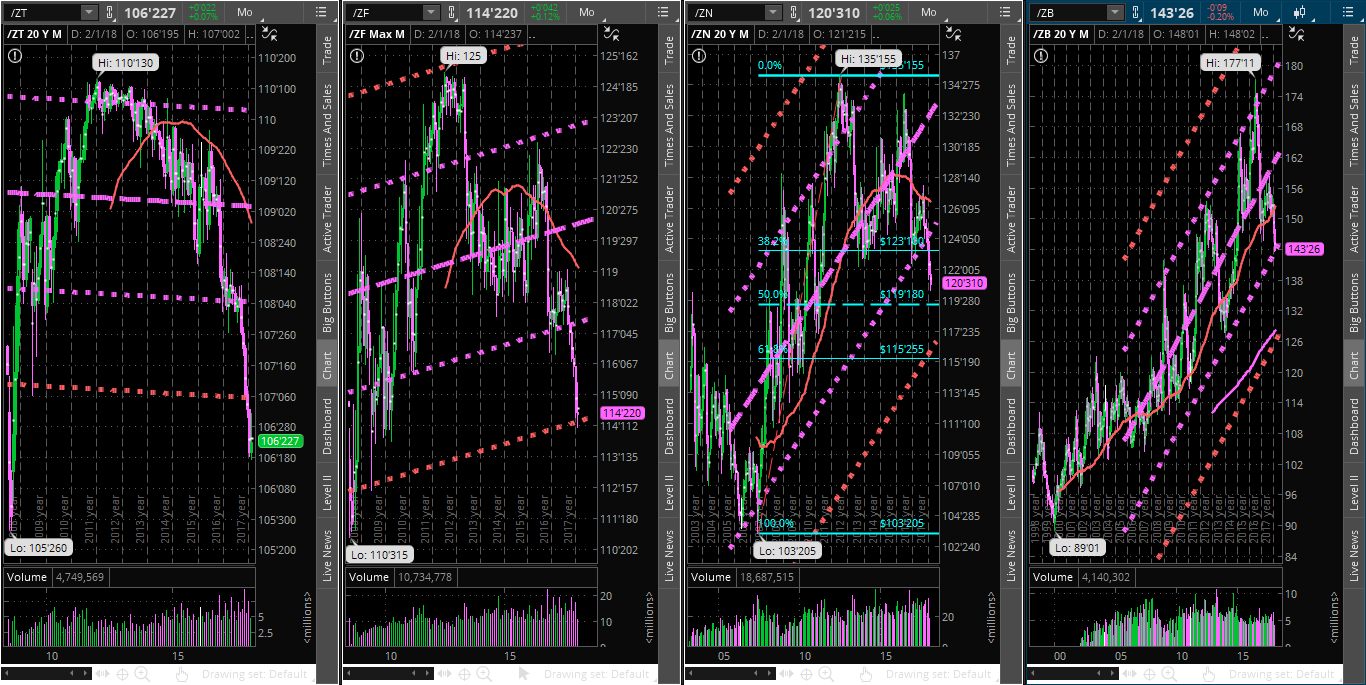
The following monthly chart grid of 2-Y-5-Y-10-Y-30-Year Bonds shows that all four of them are either at or below the -1 or -2 deviation levels of their respective long-term linear regression channels. Whether any of these begin to stabilize any time soon around these major support levels remains to be seen. The 10-YR has almost reached its 50% Fibonacci retracement level (from its lows of the 2008/09 financial crisis), so this may act as a stabilizing factor in the near-term.
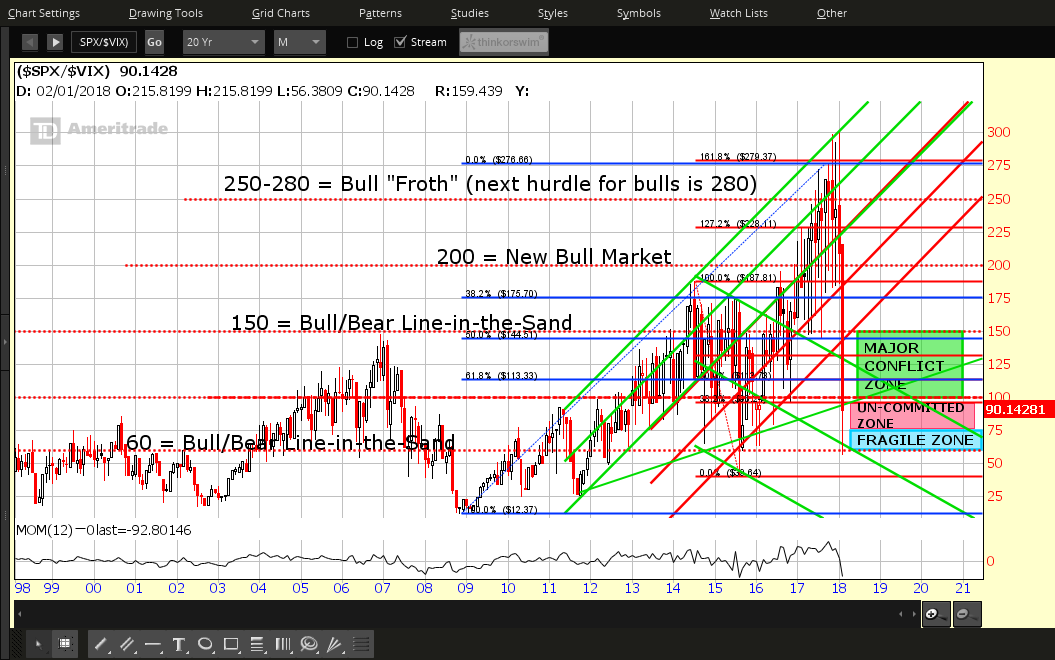
As long as the SPX:VIX ratio remains, firstly, below 150, and, then, below 200, volatility will remain elevated as shown on the monthly SPX:VIX ratio chart below. Historically, price on the SPX consists of wild, aimless/trendless and very volatile swings when this ratio remains below 150.
Now that the SPX has nearly tagged its near-term support, equities may stabilize somewhat, but could be dragged down further if the FAANGs continue to decline, as shown on the following 6-month daily thumbnail charts. Keep an eye on BMO REX MicroSectors FANG Index 3X Leveraged (NYSE:FNGU) and BMO REX MicroSectors FANG Index -3X Inverse Leveraged (NYSE:FNGD) as a potential gauge of strength/weakness of the FAANGs +5.

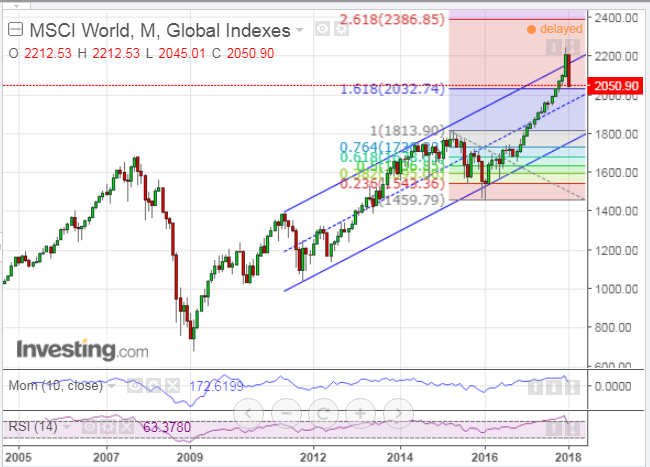
The MSCI World Index has dropped to its external Fibonacci retracement level of 1.618%, as shown on the monthly chart below. It has also fallen back into a long-term uptrending channel, after briefly popping above. A drop and hold below that level (2032.74) could send all world markets into a tailspin.
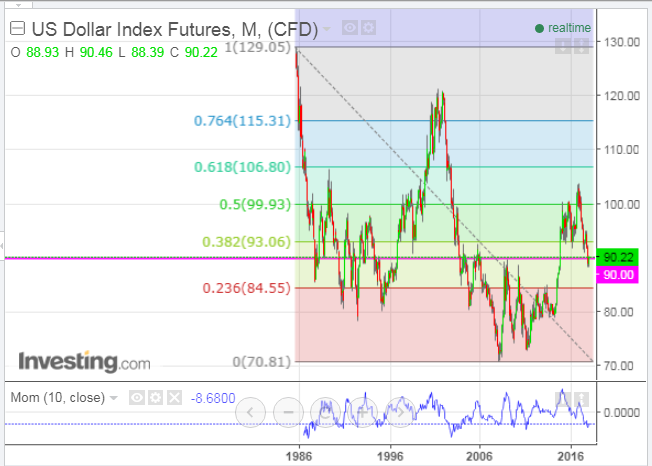
The monthly chart of the US Dollar Index shows that price is attempting to stabilize around the 90.00 level, as it closed just above on Friday. It's currently in between major support (84.55) and resistance (93.06) levels, as set by the 23.6% and 38.2% levels of a very long-term Fibonacci retracement.
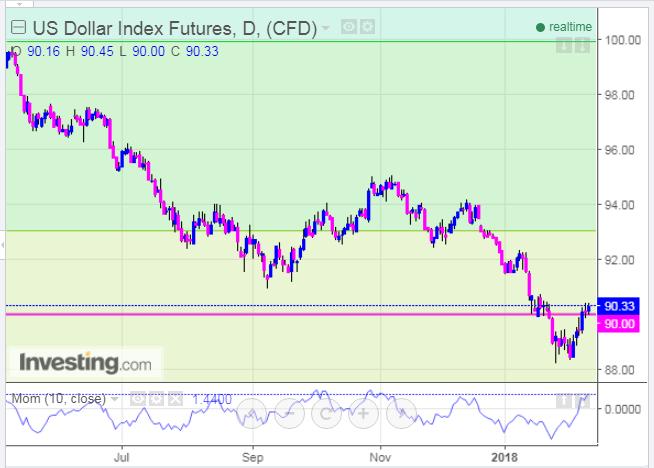
It began to break out of its recent consolidation last Wednesday, as shown on the following daily chart. The momentum indicator has popped back above the zero level and is forming a new swing high. Look for price to hold above 90.00 and for momentum to hold above zero as an indication that it may move to retest 93.06. What impact such a move may have on equities remains to be seen.
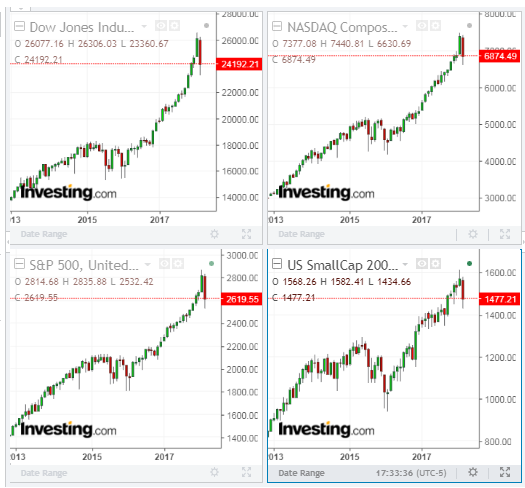
Finally, we may very well see US equity markets spike to new highs in a "slingshot" manner, as portfolio managers look to post a monthly gain for February by month-end...but, I'm not laying any odds on that happening. You can see from the monthly chartgrid below of the Dow 30, S&P 500, NASDAQ Composite, and Russell 2000 Indices that there will be a lot of ground to make up between now and then.
So, I'd keep an eye on the "volatility gauges" mentioned above for clues on equity direction, as part of your trading plan in the short term. Precisely what impact they may have on equities is difficult to pinpoint in this period of extreme volatility...but, they may be useful tools to add to your collection, nonetheless.
