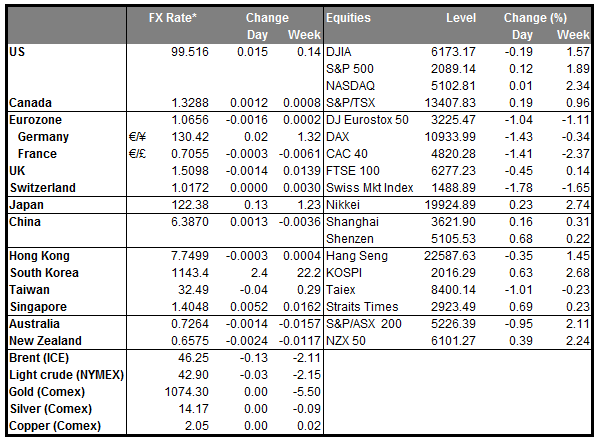
Markets in a risk-off sentiment in the first trading session of the year Investors’ risk appetite fell at the start of the year after Saudi Arabia’s execution of a Shiite cleric spurred sectarian protests and violence in the Middle East. This seems to have sparked a serious diplomatic rift as Saudi Arabia severed ties with Iran on Sunday and gave 48 hours to Iranian diplomats to leave the country. The tensions in the Middle East boost demand for the safe-haven JPY, CHF and gold in the first trading session of 2016 and the risk-off environment hit shares across Asia, with Nikkei 225 down more than 3%. The negative sentiment rolled into the European markets and DAX gapped down at its open. In addition, the turmoil in the Middle East could also support oil on supply worries and oil related currencies like CAD and NOK.
• Overnight, Chinese data showed that manufacturing activity stayed below 50 for the 10th straight month in December, spurring renewed fears over China’s economic slowdown. This added to the turmoil in the Middle East, sending the financial markets around the region well into the red.
• Today’s highlights: Monday is a PMI day. During the European day, we get the December manufacturing PMIs from Sweden and Norway, though no forecast is available for either as of yet.
• We also get the final manufacturing PMIs for December from several European countries and the Eurozone as a whole. As usual, the final forecasts are the same as the initial estimates, thus the market reaction on these news is usually limited, unless we have a huge revision from the preliminary figures. The UK manufacturing PMI for the same month is also coming out and is expected to have remained unchanged from November. As the slowdown in Q3 GDP was partly attributed to the manufacturing sector, which has recovered somewhat since then, any indications of a new downturn may weigh on the pound.
• The German flash CPI for December is forecast to have accelerated to +0.4% yoy, from +0.3% yoy in November. As usual, we will look at the larger regions for a guidance on where the headline figure may come in and thereby as an indication for the near-term direction of EUR. A rise in the inflation rate of Eurozone’s growth engine could indicate a rise in the bloc’s CPI rate due to be released on Tuesday and may support EUR, at least temporarily.
• The Canadian RBC manufacturing PMI for December is also coming out, but no forecast is currently available.
• In the US, the ISM manufacturing PMI and the final Markit manufacturing PMI, both for December are due out. The market pays more attention to the ISM index which is expected to have increased, but to still remain below the crucial 50 level. A possible rebound above 50 would indicate expansion and could prove positive for the greenback.
• As for the speakers, during the Asian session, US Cleveland President Loretta Mester speaks.
• As for the rest of the week, on Tuesday, Eurozone’s preliminary CPI for December is forecast to have accelerated to +0.3% yoy, from +0.2% yoy in November. A possible rise in the German inflation rate the day before could increase the possibilities for an improvement in the bloc’s rate as well. Given that at its last meeting, the ECB eased policy further to encourage higher inflation, an acceleration in the bloc’s CPI rate could indicate that the measures are exerting the desired effects and as such, this could support EUR a bit.
• On Wednesday, from the US, we get the ADP employment report for December, two days ahead of the NFP release. The ADP report is expected to show that the private sector gained 190k jobs, fewer than it did in the previous month where the print hit 217k, but pretty close to the 200k mark. Although an unreliable predictor of the NFP number, this could increase speculation that the NFP print on Friday may also come near 200k. Indeed, expectations for the NFP figure are currently at 200k. Also, the Fed will release the minutes from its December 15-16 FOMC meeting, where the committee raised interest rates by 25bps, in what many considered a historic move. Well before the meeting, Fed officials have been repeatedly stating that the focus should be on the pace of future rate hikes rather than the initial hike itself, something that was also confirmed by Chair Yellen at the press conference following the decision. As a result, the minutes of the meeting will be closely monitored for any hints on what other factors, besides domestic data, might affect the pace of the tightening cycle. The ISM non-manufacturing PMI and the final Markit service-sector PMI, both for December, as well as the factory orders for November are also coming out.
• On Thursday, we have no major events or indicators due to be released.
• On Friday, the main event will be the US employment report for December. The current market forecast is for an increase in payrolls of 200k, down from the 211k in November. Moreover, the unemployment rate is forecast to have remain unchanged at 5.0%, consistent with the Fed’s target of full employment, while average hourly earnings are expected to grow at the same pace as in November. After the first rate hike, Fed officials stressed that the path of future policy will be data driven, and that the labour market has shown considerable improvement, which they expect to continue. Therefore, another solid employment report could keep the FOMC members content with their current pace of tightening indicated by the ‘dot plot’. This could encourage USD-bulls to add to their positions.
• From Canada, the unemployment rate for December is expected to have remained unchanged at 7.1%, following an unexpected increase in November. This was mainly because temporary government hiring for the October federal elections was reversed. In their December monetary policy statement, the Bank of Canada described the labour market as resilient. However, with falling oil prices, we could see declining revenues and investment in the country’s energy sector to start weighing on employment, at least in oil-intensive regions.
The Market
EUR/USD rebounds from above 1.0800
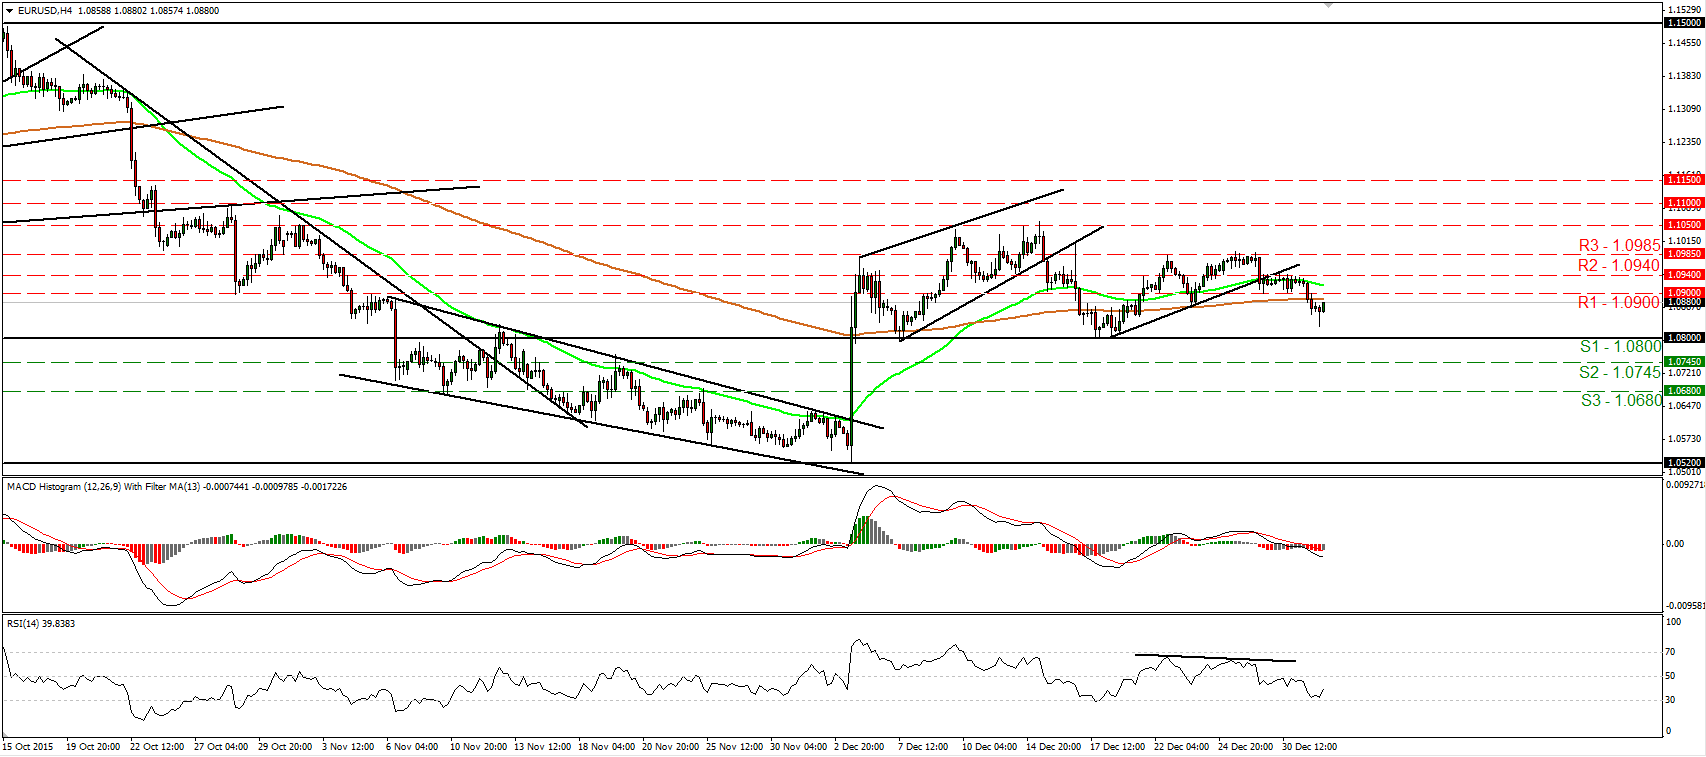
• EUR/USD traded lower on Thursday, breaking below the support (now turned into resistance) hurdle of 1.0900 (R1). However, the rate fell short of reaching the 1.0800 (S1) support level and rebounded. In my opinion, a clear move below 1.0800 (S1) is needed to carry more bearish extensions, something that could initially aim for the next support level of 1.0745 (S2). For now though, taking a look at our oscillators, I see signs that the current rebound may continue for a while, perhaps even back above 1.0900 (R1). The RSI rebounded from marginally above its 30 line and now points up, while the MACD, although negative, shows signs that it could start bottoming. Switching to the daily chart, I see that on the 7th and 17th of December, the rate rebounded from the 1.0800 (S1) key hurdle, which is also the lower bound of the range it had been trading from the last days of April until the 6th of November. As a result, I prefer to maintain a neutral stance as far as the overall outlook is concerned as well.
• Support: 1.0800 (S1), 1.0745 (S2), 1.0680 (S3)
• Resistance: 1.0900 (R1), 1.0940 (R2), 1.0985 (R3)
EUR/GBP rebounds from 0.7335
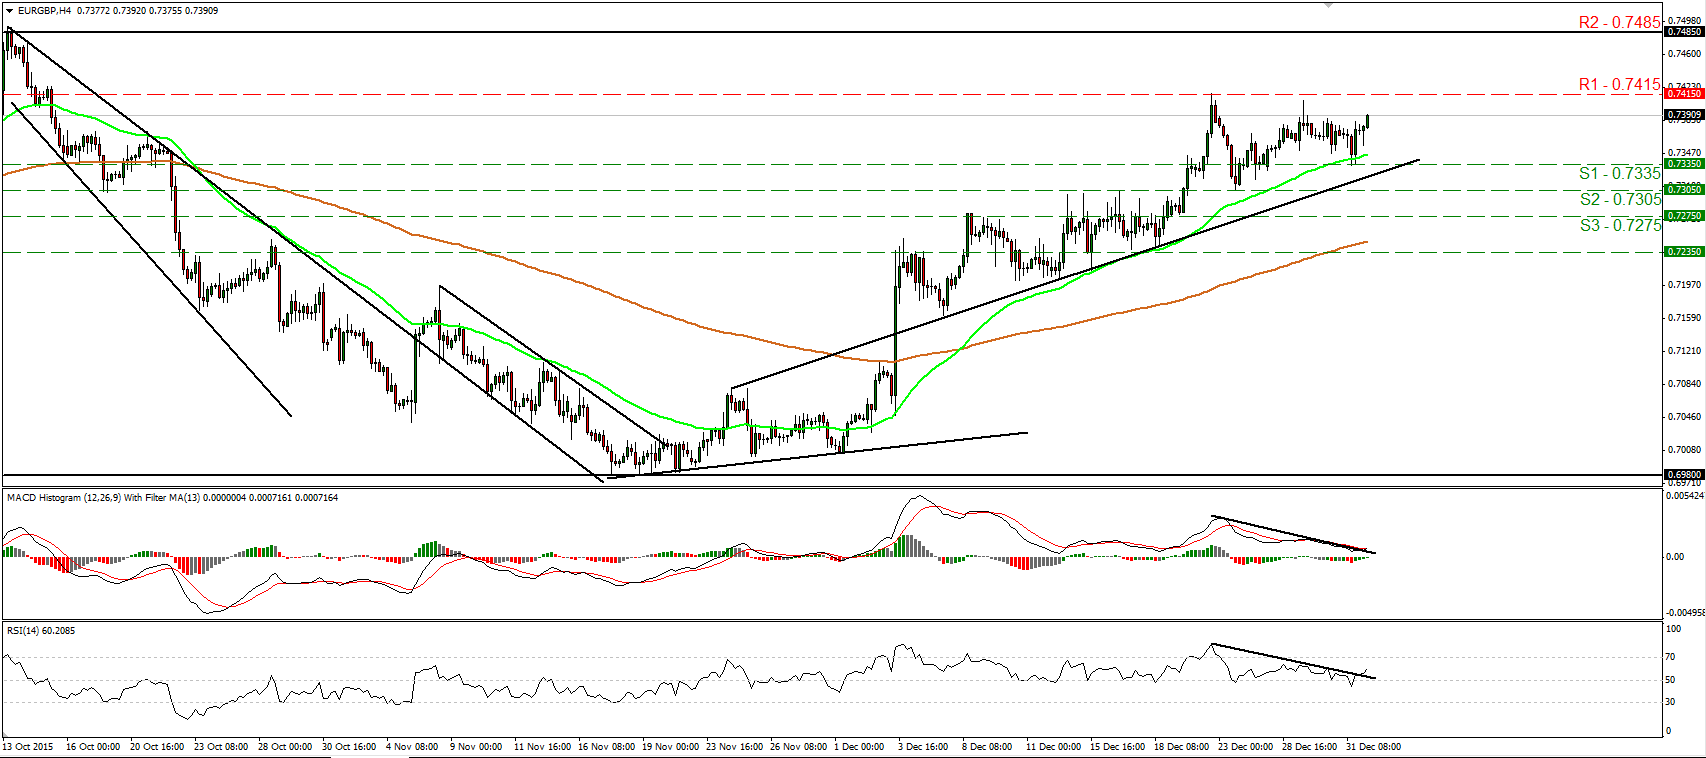
• EUR/GBP traded higher after it found support at 0.7335 (S1). As long as the rate is trading above the short-term uptrend line taken from back the low of the 7th of December, the short-term bias remains to the upside in my view. However, a move above the key resistance zone of 0.7415 (R1) is needed to confirm a forthcoming higher high and perhaps signal the continuation of that short-term uptrend. Such a break is likely to see scope for extensions towards the next resistance zone of 0.7485 (R2). Our short-term momentum indicators reveal upside momentum and corroborate my view. The RSI rebounded back above its 50 line and is now pointing up, while the MACD, already positive, has bottomed and crossed above its trigger line. What is more, both these indicators emerged above their downside resistance lines. Switching to the daily chart, I see that the rate has been trading within a wide sideways range between the 0.6980 support area and the resistance zone of 0.7485 (R2). As a result, although I see a near-term uptrend, I would like to hold a “wait and see” stance as far as the overall outlook of this pair is concerned.
• Support: 0.7335 (S1), 0.7305 (S2), 0.7275 (S3)
• Resistance: 0.7415 (R1), 0.7485 (R2), 0.7500 (R3)
USD/JPY breaks below 120.00
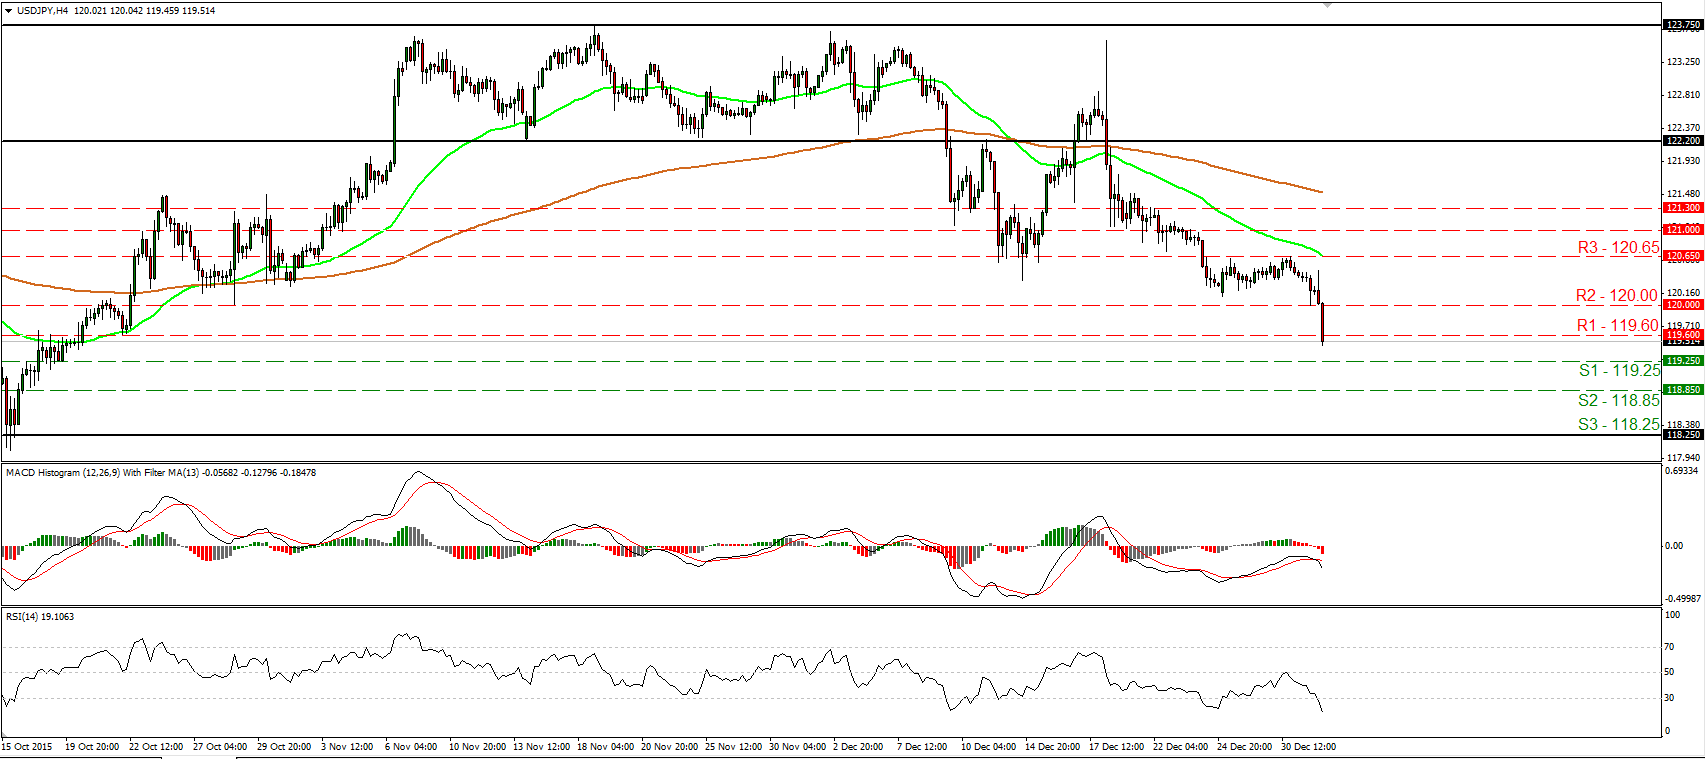
• USD/JPY tumbled during the Asian morning Monday, falling below the psychological zone of 120.00 (R2). The short-term outlook remains negative in my view and therefore, I would expect the bears to maintain their momentum and perhaps challenge the 119.25 (S1) support zone in the short run. Another dip below that zone is likely to aim for the next support obstacle at 118.85 (S2). Our short-term oscillators detect strong downside speed and magnify the case for further declines. The RSI slid and fell below 30 after it found resistance at its 50 line, while the MACD, already negative, has topped and fallen below its trigger line. As for the broader trend, the break below the 122.20 resistance zone, the lower boundary of the sideways range the pair had been trading from the 6th of November until the 9th of December, has turned the medium-term picture to the downside in my view.
• Support: 119.25 (S1), 118.85 (S2), 118.25 (S3)
• Resistance: 119.60 (R1), 120.00 (R2), 120.65 (R3)
Gold gaps higher
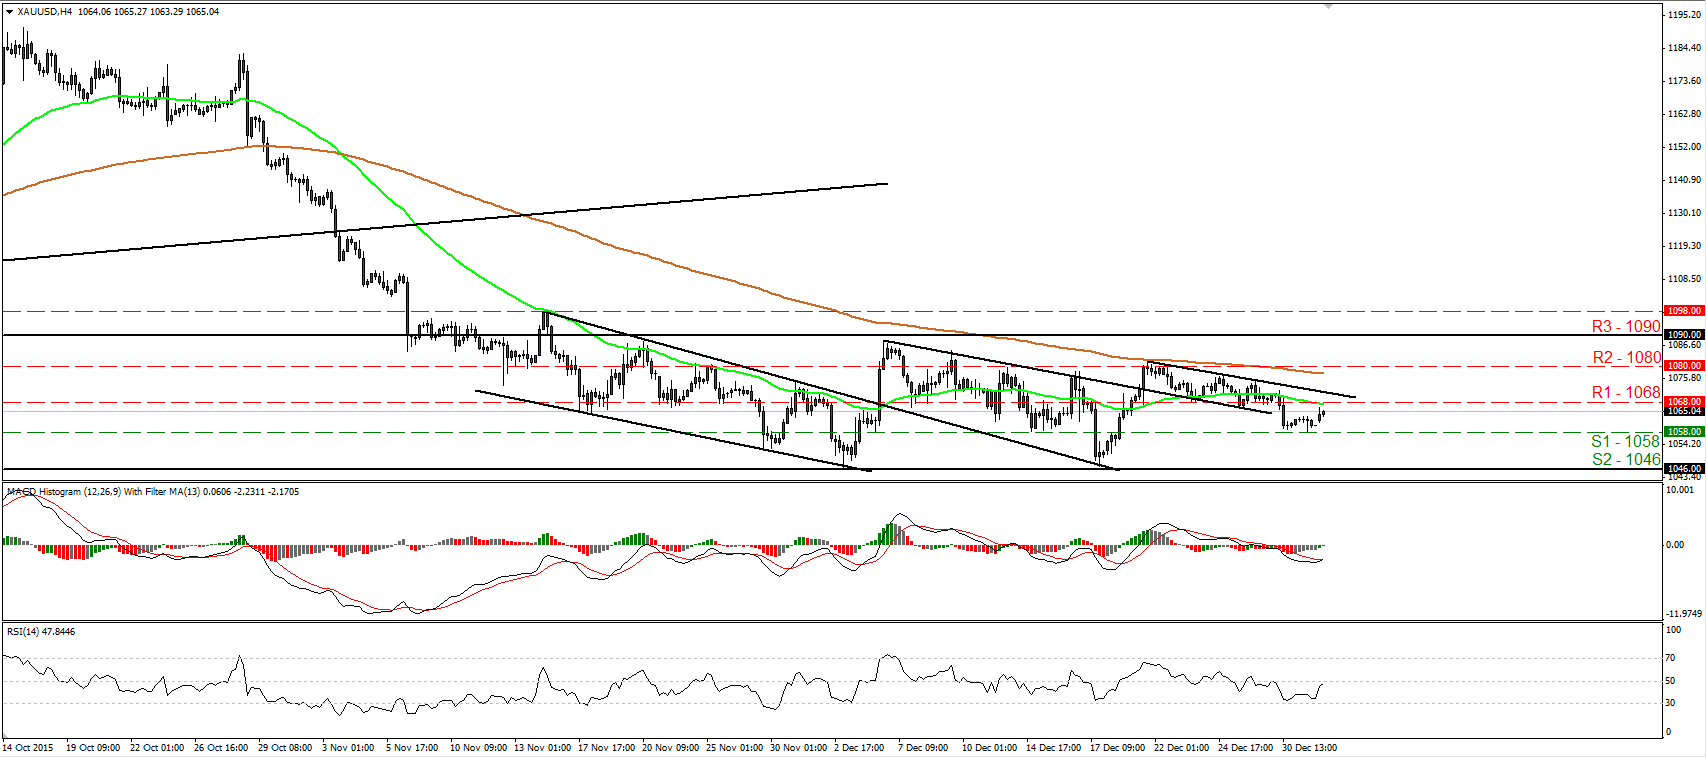
• Gold gapped higher on Monday after it hit support once again at 1058 (S1) on Thursday. The short-term outlook still looks cautiously negative but for now, I see the possibility for the current rebound to continue for a while. Our momentum indicators corroborate that view as well. The RSI rebounded from slightly above its 30 line and now looks ready to challenge its 50 line, while the MACD, although negative has bottomed and crossed above its trigger line. A clear break above the 1068 (R1) barrier and the minor-term downtrend line taken from the peak of the 21st of December is likely to confirm the case for further rebound and is possible to set the stage for extensions towards the 1080 (R2) resistance zone. As for the broader trend as long as the metal is trading between 1046 (S2) and 1090 (R3), I prefer to stay flat as far as the longer-term picture is concerned.
• Support: 1058 (S1), 1046 (S2), 1040 (S3)
• Resistance: 1068 (R1), 1080 (R2), 1090 (R3)
WTI rebounds from 36.35
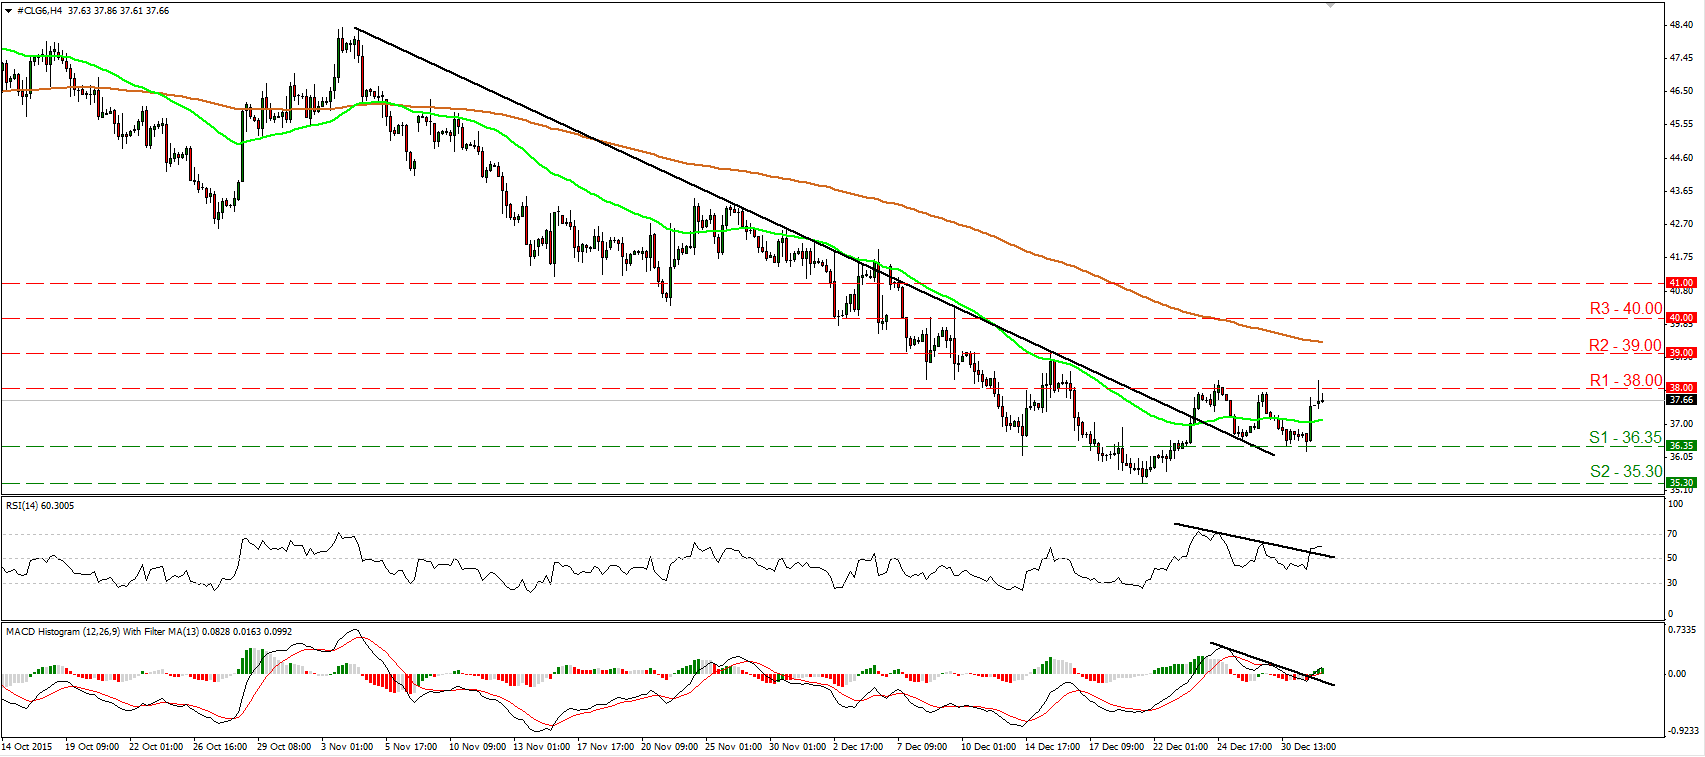
• WTI traded higher on Thursday after it hit support near the 36.35 (S1) barrier. However the advance was stopped near the 38.00 (R1) resistance zone. The price is trading above the downtrend line taken from the 4th of November, but I prefer to see a clear move above 38.00 (R1) before I get confident on the upside, at least in the short run. Such a move is likely to initially aim for the next obstacle area of 39.00 (R2). Taking a look at our short-term oscillators, I see that the RSI emerged back above its 50 line, while the MACD moved above both its zero and trigger lines. Furthermore, both the indicators crossed above their respective downside resistance lines. On the daily chart, I see that WTI has been printing lower peaks and lower troughs since the 9th of October. As a result, I would consider the longer-term picture to stay negative and I would treat any possible future upside extensions as a corrective phase, at least for now.
• Support: 36.35 (S1), 35.30 (S2), 35.00 (S3)
• Resistance: 38.00 (R1), 39.00 (R2), 40.00 (R3)

