Friday belonged to Bears as sellers finished the week in control but bulls still have support to lean on in the shape of moving averages.

The S&P 500 is leaning on the 50-day MA with 'sell' triggers in the MACD, On-Balance-Volume, and ADX, although relative performance ticked up against the Russell 2000. Volume rose in confirmed distribution. Monday is a fresh chance for bulls to recover the losses.

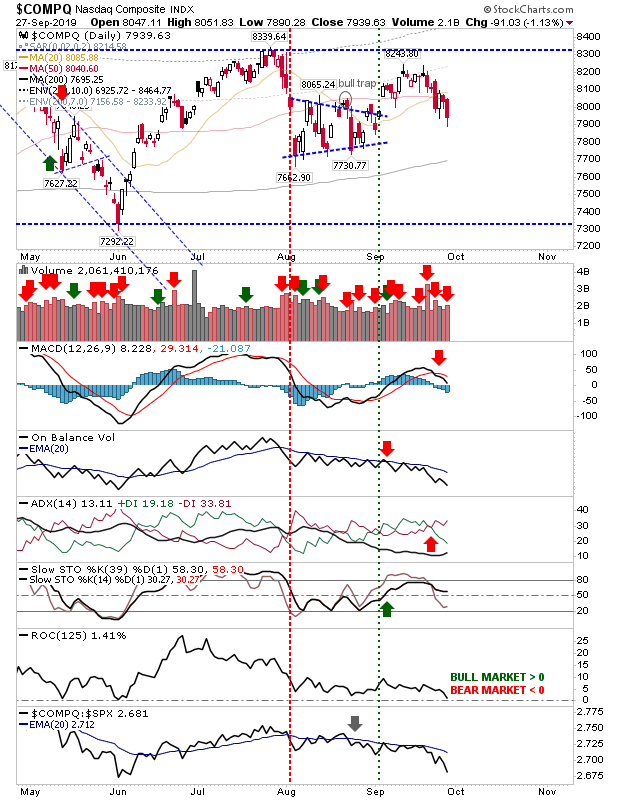
The Nasdaq accelerated its relative losses against the S&P. The index has already undercut its 20-day and 50-day MAs, but next up is the 200-day MA.

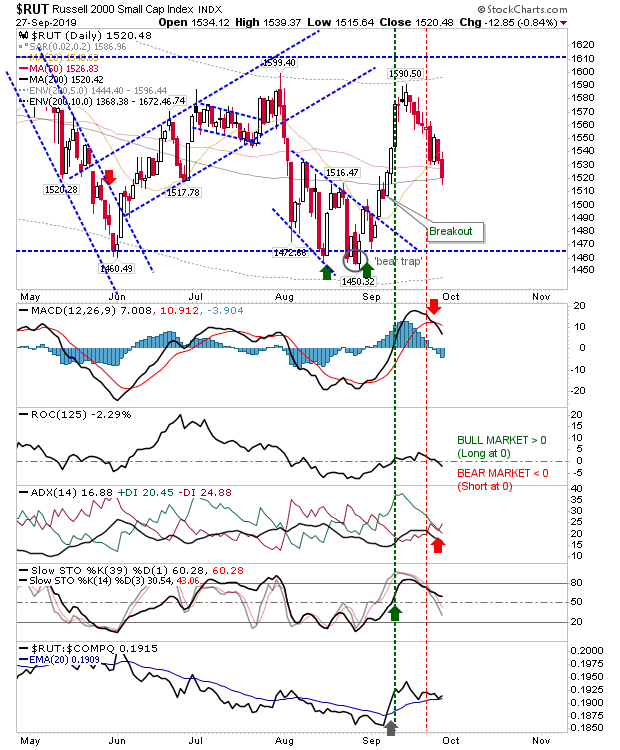
The Russell 2000 finished at its 200-day MA, which is the last point of support before the index is looking at a retest of 1,465 - and likely further losses as this rally has so failed to challenge the 52-week high; tomorrow could be its last chance to do so. Relative performance is still positive.
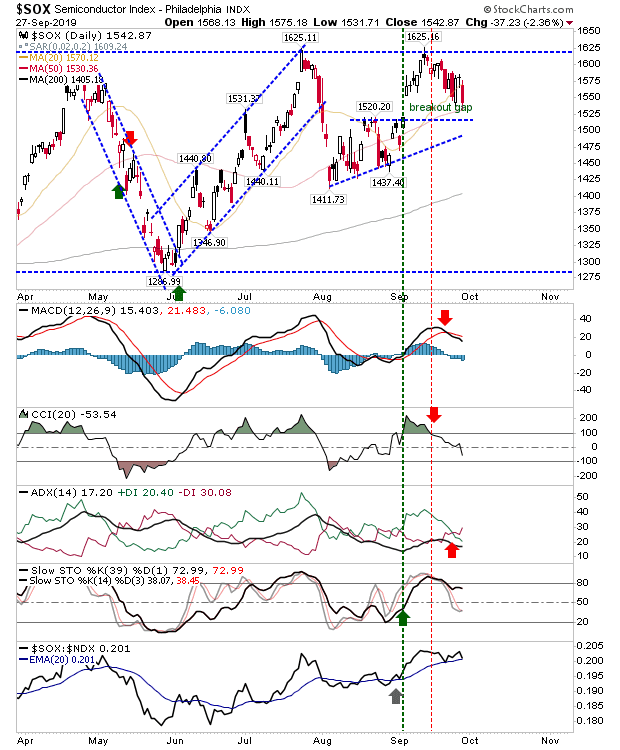
The Semiconductor Index has yet close its breakout gap, but it has defended its 50-day MA. However, the Nasdaq could do with a gain here to help it attempt to recover its 50-day MA.

For next week, it will be important losses do not extend as 200-day MAs are next support and they are a few weeks away from a test.
