Last week, I updated the analysis on the break above the 200-dma, which changed the market’s complexion.
“If the markets can break above the 200-dma, and maintain that level, it would suggest the bull market is back in play.”
Then, in our Tuesday follow up, we discussed how the markets had pushed to more extreme overbought conditions and the importance of the market to hold the 200-dma on a subsequent correction.
“That correction came swiftly on Thursday. The surge in COVID-19 cases in the U.S. undermined the “V-Shaped” economic recovery meme. As we noted, the market had rallied into overhead resistance, and the correction found support at the 200-dma.”
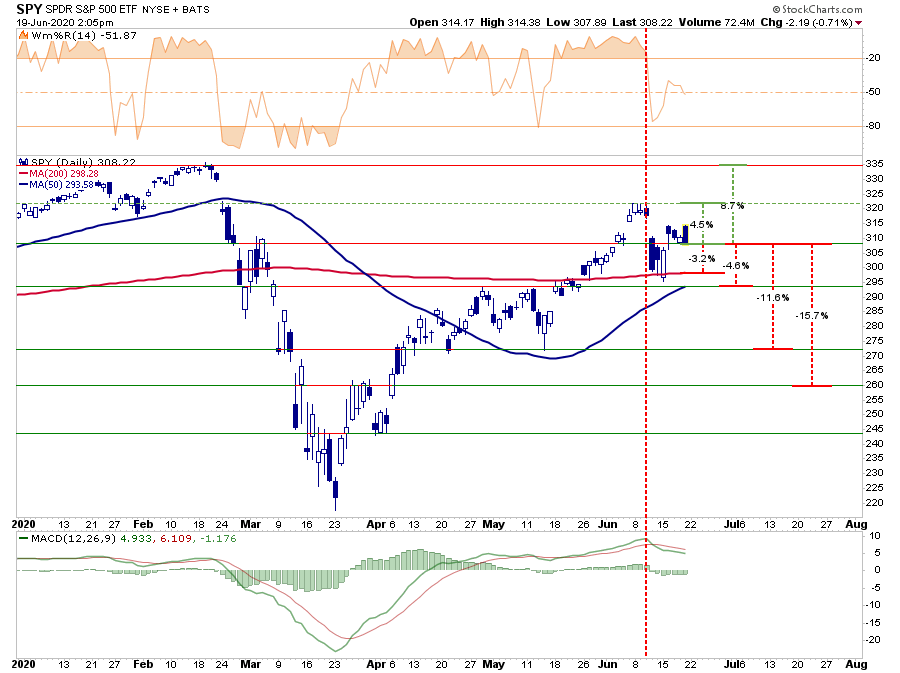
As we saw in April and May after the initial surge off the March 23rd lows, the market has once again begun to consolidate its gains to work off the short-term overbought extension. With Friday’s sell-off, we can update our risk/reward range, which has turned more positive in the short-term.
- -2.9% to the 200-dma vs. +4.9% to recent highs. Positive
- -5.7% to the 50-dma vs. +9.1%% to all-time highs. Positive
- -11.2% to previous consolidation lows vs. +9.1% to all-time highs. Negative
- -15.2% to March bounce peak vs. +9.1% to all-time highs. Negative
However, the market reversal on Friday from a strong opening to a weak close, is a good reminder of just how volatile markets can be. Despite the technical backdrop becoming more bullish short-term, we hedge our portfolios against just this type of risk.
From Bubble, To Bust, To Bubble
In January and February of this year, we wrote articles discussing why we were taking profits from our portfolios and reducing overall portfolio risk. In “This Is Nuts,” we stated:
“When you sit down with your portfolio management team, and the first comment made is ‘this is nuts,’ it’s probably time to think about your overall portfolio risk. On Friday, that was how the investment committee both started and ended – ‘this is nuts.’
We discussed the overbought, extended, and complacent market over the last couple of weeks. Still, on Friday, I tweeted out a couple of charts that illustrated the excess.”
That was on January 6th.
Yesterday, I tweeted out some interesting charts:
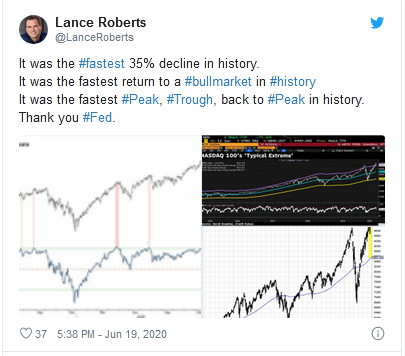
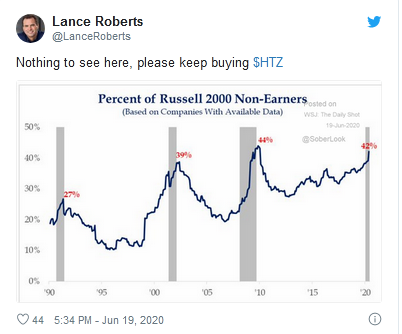
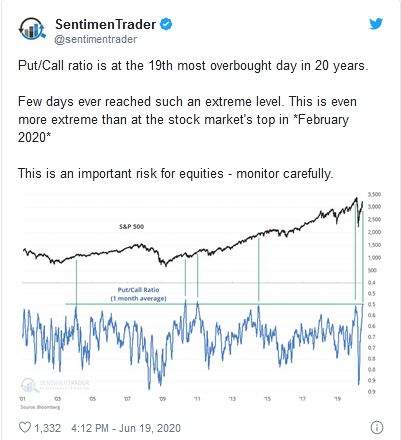
This Is Nuts
Our portfolio management meeting Friday morning started with “This is nuts.”
Importantly, I want to direct your attention to the Nasdaq, which is where portfolio managers have been stuffing cash.
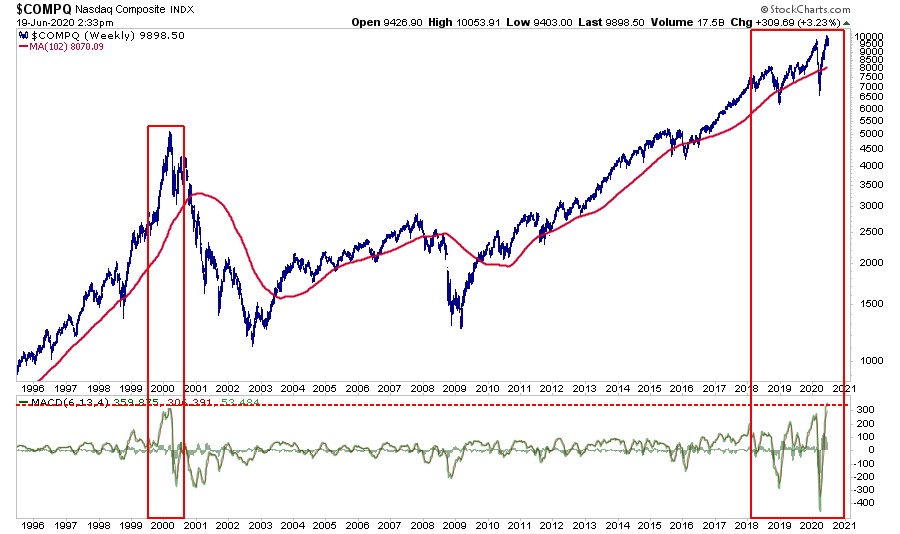
There are several things to note about the chart above:
- Every time, and it is only a function of time, the Nasdaq gets extremely extended above the 2-year moving average, it reverts to, or beyond, that average.
- The MACD is more extremely extended currently than in the past 25-years.
- The current deviation above the 2-year moving average matches the extension seen in February before the collapse.
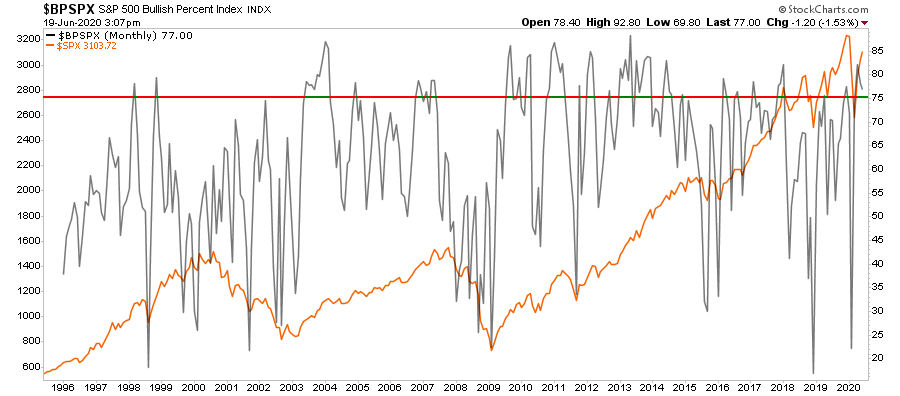
On the S&P 500, there are warning signs as well. As shown below, the number of stocks on “bullish buy signals” has reached an extreme weekly. Historically, such extremes have preceded short-term corrections and bear markets.
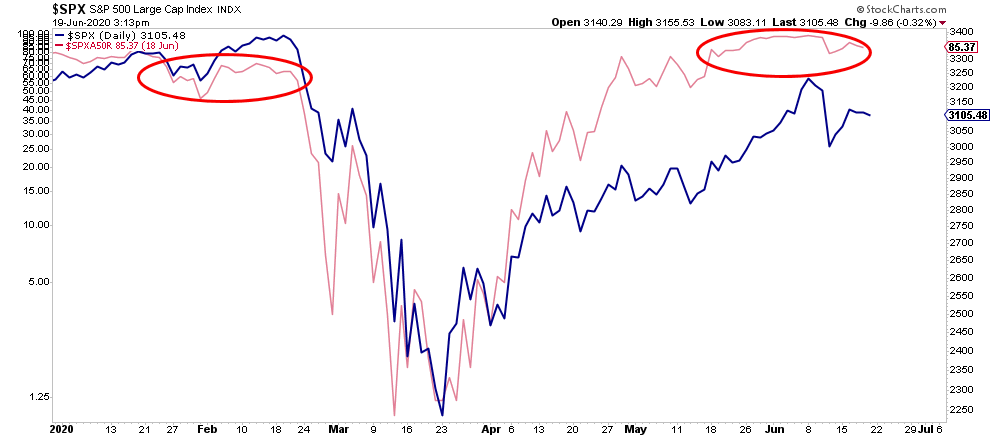
Also, as noted last week, the number of S&P 500 stocks trading above their 50-dma has peaked and started to turn lower. Such has always been a precursor to a short-term correction or worse.
At the moment, the over-riding investment belief is that markets can’t decline because of the Fed. However, all it will take is an unexpected, exogenous event to trigger selling and quick correction of 10-15% due to the current lack of liquidity in the market.
What could such an event be? I have no clue. The market has already factored that in a second wave of the Virus. However, one thing no one is currently expecting is for states to shut down commerce once again. I don’t think that will happen either, but you get my point.
Again, this is why we maintain our hedges.
The Problem With Two-Year Forecasts
As markets get overly bullish, extended, and exuberant, Wall Street tends to come up with new ways to “sucker,” I mean “rationalize,” investors into taking on additional risk.
One thing I had hoped for in 2018-2019 is that we would get a correction large enough to revert some of the excessive valuation levels which existed. Such would provide higher future rates of return over the next decade, allowing investors to reach their investment goals.
Instead, through the Fed’s actions, the correction was halted, and the “clearing process” was not allowed to occur. The outcome has been even higher levels of corporate leverage, and valuations remain grossly elevated on many different levels.
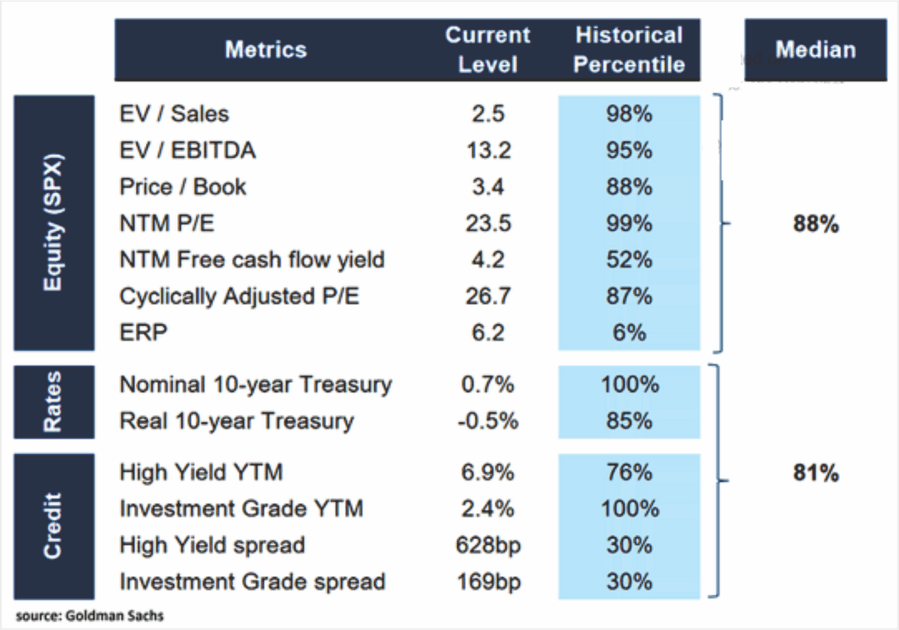
So, how does Wall Street justify “buying stocks” in the current environment of recessionary economic growth, high unemployment, and collapsing earnings? Easy, you just tell uneducated investors to use earnings estimates 2-years in the future.
“Yes, stocks are expensive based on current earnings, but cheaper using earnings in 2022.” – Wall Street
Faulty Analysis Leads To Faulty Outcomes
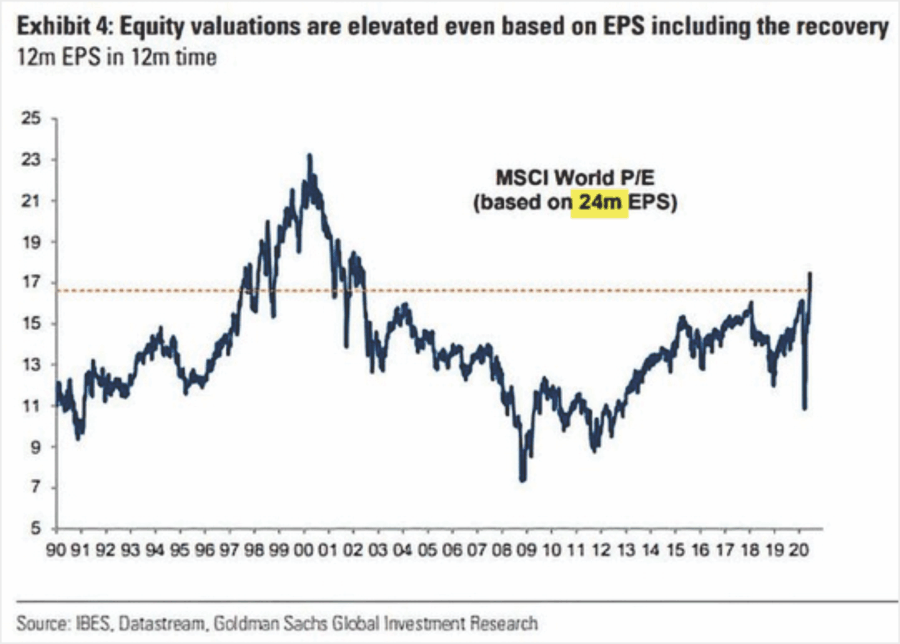
There are significant problems with this analysis. The first is that even based on 24-month estimates, stocks are still historically expensive.
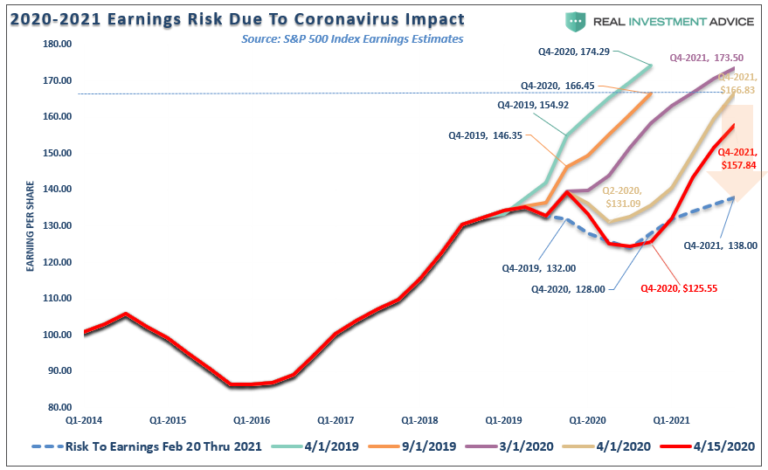
Secondly, Wall Street is terrible at estimating forward earnings. Historically, forward estimates are about 33% too high before they are ratcheted sharply lower. So, even if you assume the stock prices don’t move over the next two years, as future estimates are lowered, valuations will rise further.
Using Wall Street logic, if you were buying stocks in 2018 using 2020 estimates, you grossly overpaid for value and wound up paying the price.
Lastly, think about the stupidity of the statement for a moment.
You are paying for earnings two years into the future. Such means that you will have NO appreciation in the price for two years to maintain the “valuation” of what you paid today. Furthermore, every year going forward will have to have higher earnings estimates than current just to maintain the same valuation.
Such is why valuations are so important. By overpaying for assets today, and locking in earnings 24-months into the future, you have guaranteed yourself a long-term period of low returns.
Do you now understand why Buffett is sitting on $137 billion in cash?
A Bearish Pattern Remains
In the short-term, however, the technical backdrop of the market keeps the bulls in control. The market had gotten overheated, but the correction over last week successfully retested the 200-dma.
However, on a monthly basis, there is still a more “bearish” pattern in the works. The broadening range of highs and lows, known as a “broadening” or “megaphone” pattern, is characterized by two diverging trend lines. As noted by Investopedia:
“Broadening formations occur when a market is experiencing heightened disagreement among investors over the appropriate price of a security over a short period. Buyers become increasingly willing to buy at higher prices, while sellers always find more motivation to take profits. This creates a series of higher interim peaks in price and lower interim lows. When connecting these highs and lows, the trend lines form a widening pattern that looks like a megaphone or reverse symmetrical triangle.
The price may reflect the random disagreement between investors, or it may indicate a more fundamental factor. These formations are relatively rare during normal market conditions over the long-term since most markets tend to trend in one direction or another over time. For example, the S&P 500 has consistently moved higher over the long-term. Therefore the formations are more common when market participants have begun to process a series of unsettling news topics. Geopolitical conflict or a change of direction in Fed policy, or especially a combination of the two, are likely to coincide with such formations.”
The Technical Chart
You can understand why there is a disagreement among investors given the current backdrop of a recessionary economy and a bullish stock market driven by the Fed. The ongoing “broadening formation,” which is typical of longer-term market tops, is coupled with a negative divergence in the Relative Strength Index.
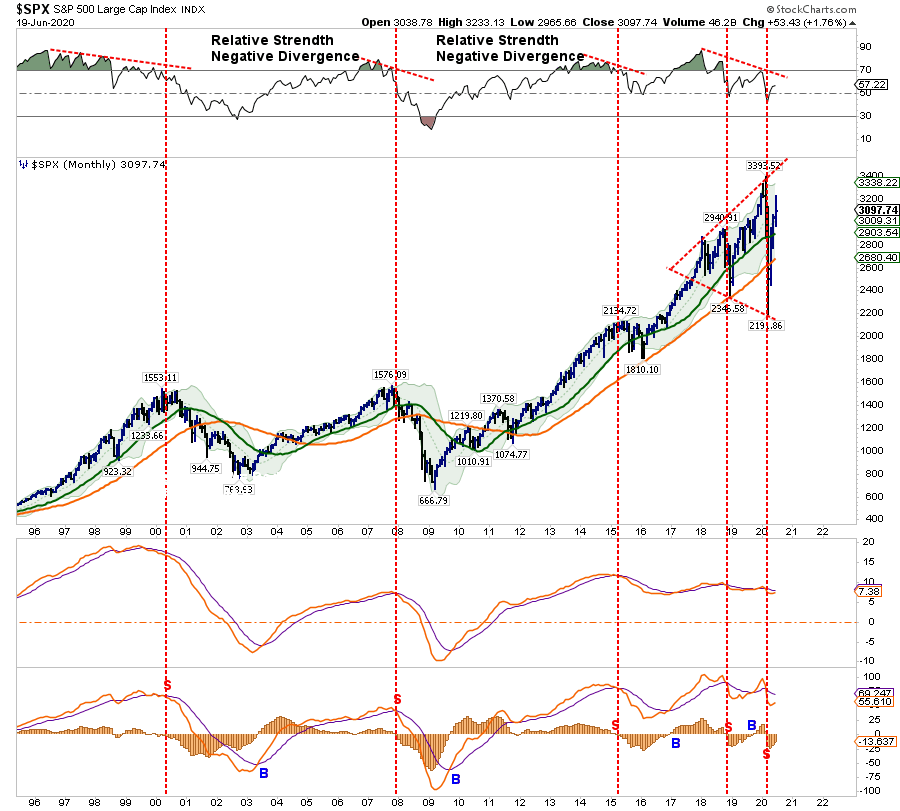
Given this is a “monthly” chart, such doesn’t mean the market will crash tomorrow, if even at all. However, it is one of those warning signs which continue to suggest a bit of caution in portfolios is likely advisable.
Portfolio Positioning Update
With our portfolios almost fully allocated towards equity risk in the short-term, we remain incredibly uncomfortable. As noted on Tuesday:
“From a purely technical perspective, the bulls remain in control for now. Fundamentally speaking. However, we remain ‘bears.’ We also realize that with the Federal Reserve intravenously feeding liquidity into the markets, we need to participate. As we stated last week:
“As a portfolio manager, we buy ‘opportunity’ because we have to. If we don’t, we suffer career risk, plain and simple. However, you don’t have to. If you are indeed a long-term investor, you have to question the risk undertaken to achieve further returns in the market currently.”
As noted, fundamentals will eventually matter. We just don’t know when that will ultimately be the case. However, there are more than enough signs to know we are likely close to a peak:
- Wall Street firms using 2-year forward “operating (or B.S.)” earnings to justify valuations.
- Investors are chasing bankrupt companies.
- Companies rampantly issuing debt to shore up liquidity
- A complete lack of market liquidity.
- Investor over-confidence
- Retail investor exuberance.
- Overly estimated future earnings growth.
You get the idea.”
As I stated, we are participating, but it doesn’t mean we have to like it. We just have to respect the market for what is.
We continue to hedge our equity exposure with fixed income, dollar, and gold investments. While such hedging does reduce the participation of our equity portfolio short-term, it has mitigated the risk of sudden and unexpected sell-offs.
We are very confident we are not in a “no risk” market currently.
