With investors throwing investing caution to the wind, technically speaking, it’s time to take on defensive positioning. Such was the warning we discussed previously. To wit:
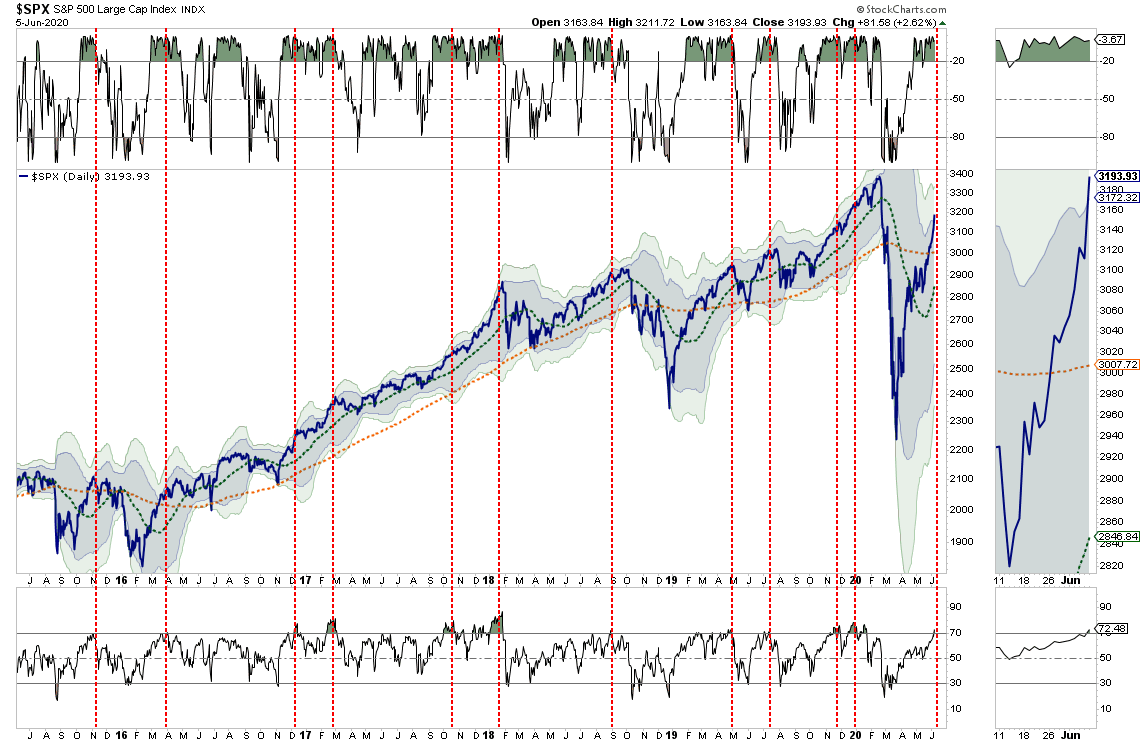
“Regardless, the markets are bullish biased, and we must be respectful of that reality. No matter how you slice the data, the markets are back to more extreme overbought conditions on a short-term basis.
The break above the 200-dma triggered a parabolic advance in the market over the last week. The market is making a 3-standard deviation move to the upside. With indicators very overbought, short-term corrective action is likely. (Note the market was just 3-standard deviations BELOW the 50-dma in March.)”
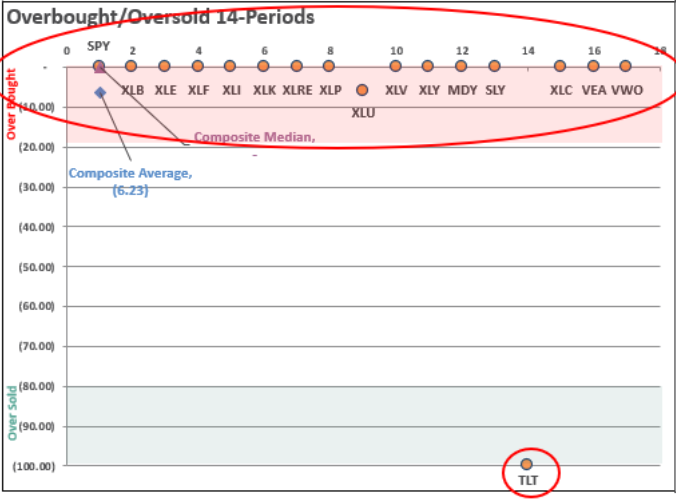
The number of sectors and markets which are trading at extreme overbought levels confirms this extension. The chart below shows a market rarity. Every sector and market, except for bonds, is extremely overbought.
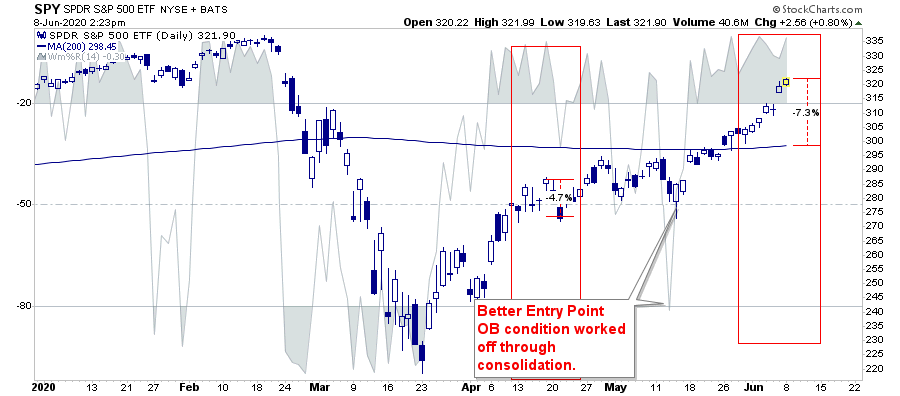
The last time this happened was in the second week of April, which preceded a 4% correction, and then resolved itself in a month-long consolidation. The next good entry point came in mid-May. The price level was relatively unchanged, and the risk/reward for adding risk exposure was much improved.
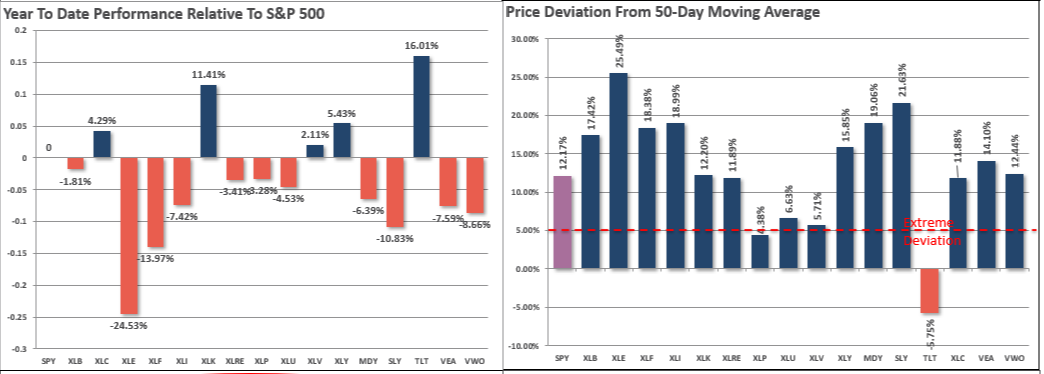
The short-term overbought condition becomes further complicated by the more extreme deviations from the 50-day moving average. Historically, prices remain confined to a maximum deviation of +/- 5-7% from its short-term moving average. As shown below, we have blown well past those norms.
A Warning Sign For Defensive Positioning
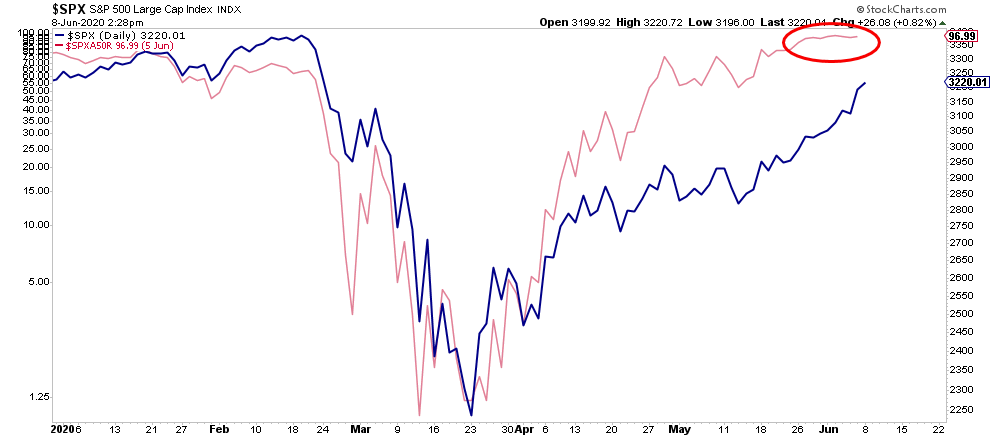
With more than 95% of stocks now trading above the 50-dma, such has historically signaled short-term market corrections. Currently, the number of stocks above their 50-dma stalled at one of the highest levels in a decade. Watch for deterioration, or a negative divergence, in the percentage to signal an upcoming correction.
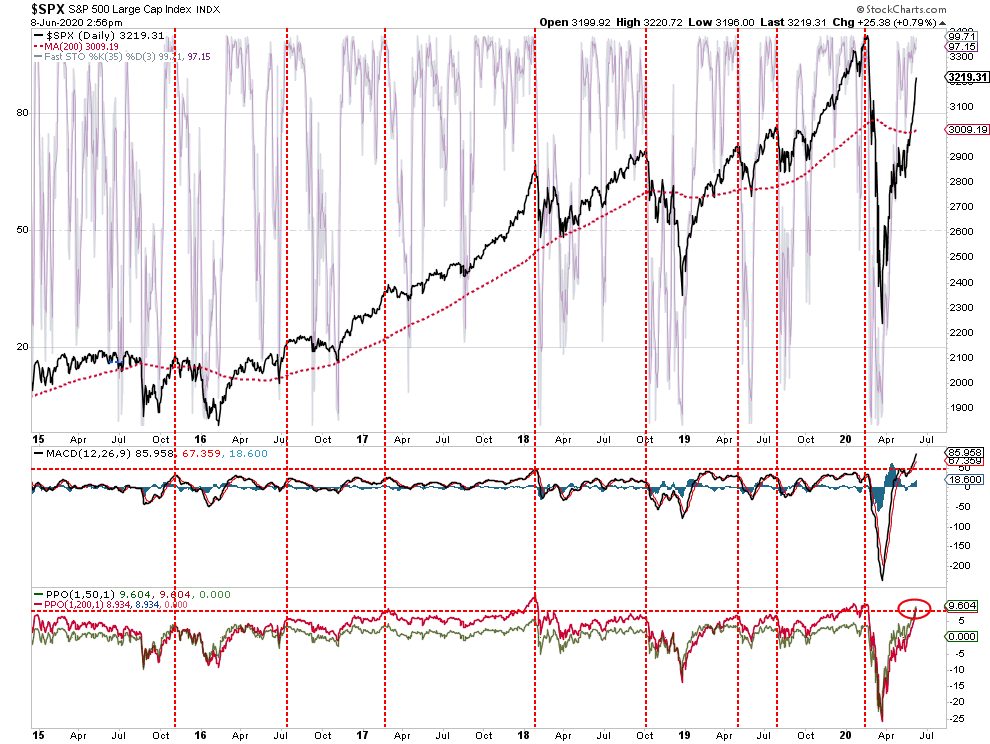
With the vast majority of stocks being above the 50- and 200-dma moving averages, all short-term momentum indicators are now egregiously overbought. As noted by the vertical red lines, when every measure is at historically overbought levels, corrections are frequent.
Short Covering Rallies Are Short-Lived
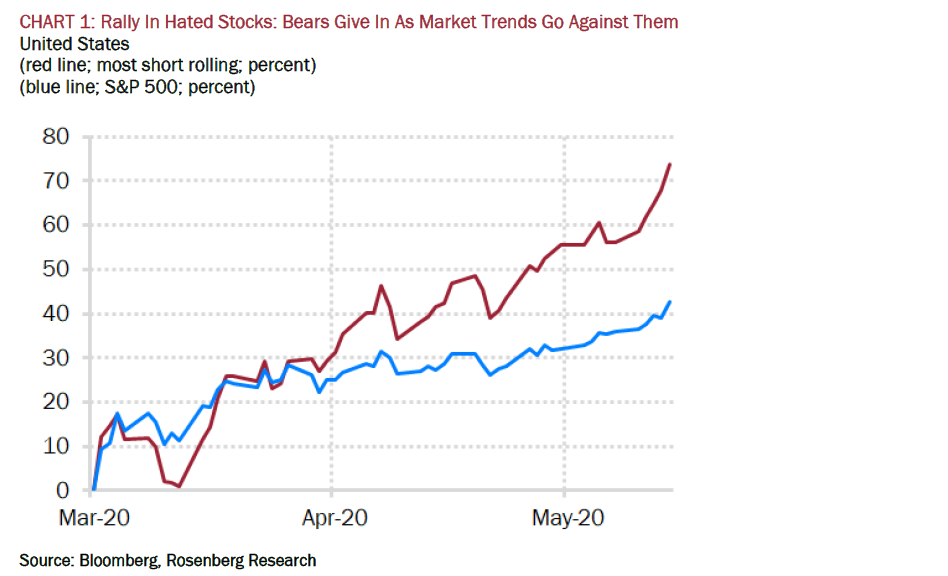
The furious rally in the “fundamentally weak” areas of the market was a painful counter-trade against investors with a fundamental discipline.
As David Rosenberg noted yesterday:
“While it is hard to identify real buyers in the flow data, there is no selling of equities, and that alone is extremely important. On top of that, we have a huge short squeeze going on — the most shorted stocks have collectively soared 65% from the March lows. The CFTC data shows a squeezing of the four-year high net speculative short position on the CME. (Down 14% last week to 38,593 net S&P 500 short contracts to a three-week low).”
He is right, and this was a point I noted on Saturday.
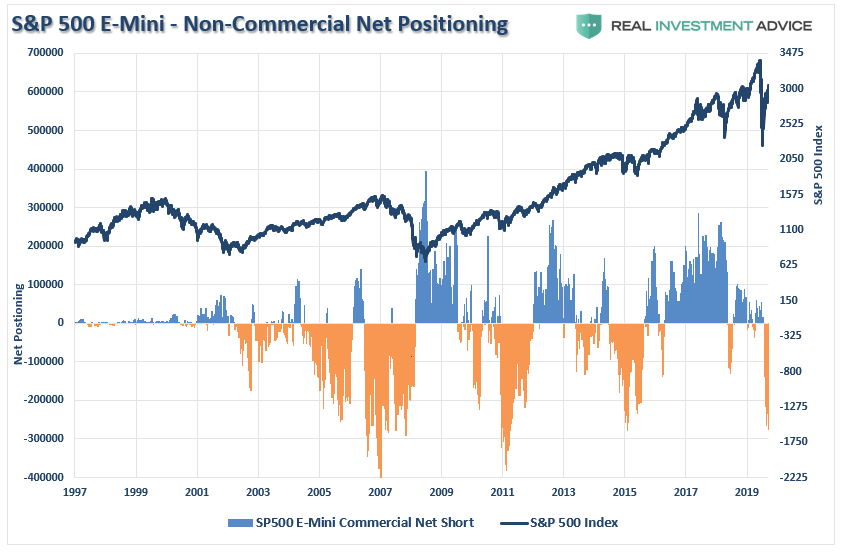
“Currently, non-commercial speculators are carrying one of the largest net-short positions on the S&P 500 in recent history. While such positioning doesn’t necessarily mean the market will crash, it has historically aligned with short-term peaks and bear markets.”
The total put-call ratio all suggests similar positioning. With investors getting extremely aggressive by buying call options, the ratio is back to a historical high. The last time the put-call ratio was this elevated was in January, when the belief was the “economy was firing on all cylinders.”
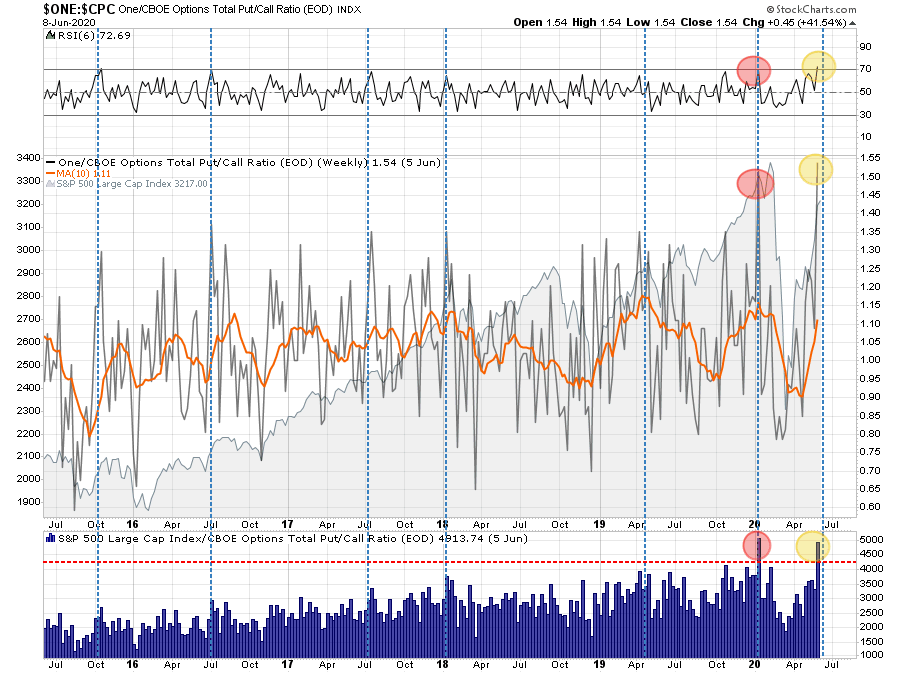
Such extremes do not historically last long and usually resolve themselves within a couple of weeks to months.
Buying Because We Have To
We can not dismiss the issues of technical price deviations, valuations, and subsequent risk when adding exposure. By the majority of measures that we track from momentum to price, and deviation, the market’s sharp advance has pushed the totality of those indicators back to overbought.
I understand if this seems confusing, but it is the difference between chasing markets short-term, versus longer-term outcomes for portfolios. This analysis is part of our thought process as we continue to weigh “equity risk” within our portfolios.
Let me be clear about something.
As a portfolio manager, we buy “opportunity” because we have to.
If we don’t, we suffer career risk, plain and simple.
However, you don’t have to. If you are indeed a long-term investor, you have to question the risk undertaken to achieve further returns in the market currently.
While we may indeed be shifting exposure and taking on some additional risk, we do so very cautiously.
Defensive Positioning
While we did increase our exposure to the markets yesterday, as the bullish trend continues, we did so in more “defensive” areas. With the momentum “junk” trade now very extended, we should see a rotation back into utilities, real estate, health care, and technology. (Which may already be underway.)
Furthermore, as noted Saturday, we are also backing that increase in equity risk with increases in our bond holdings.
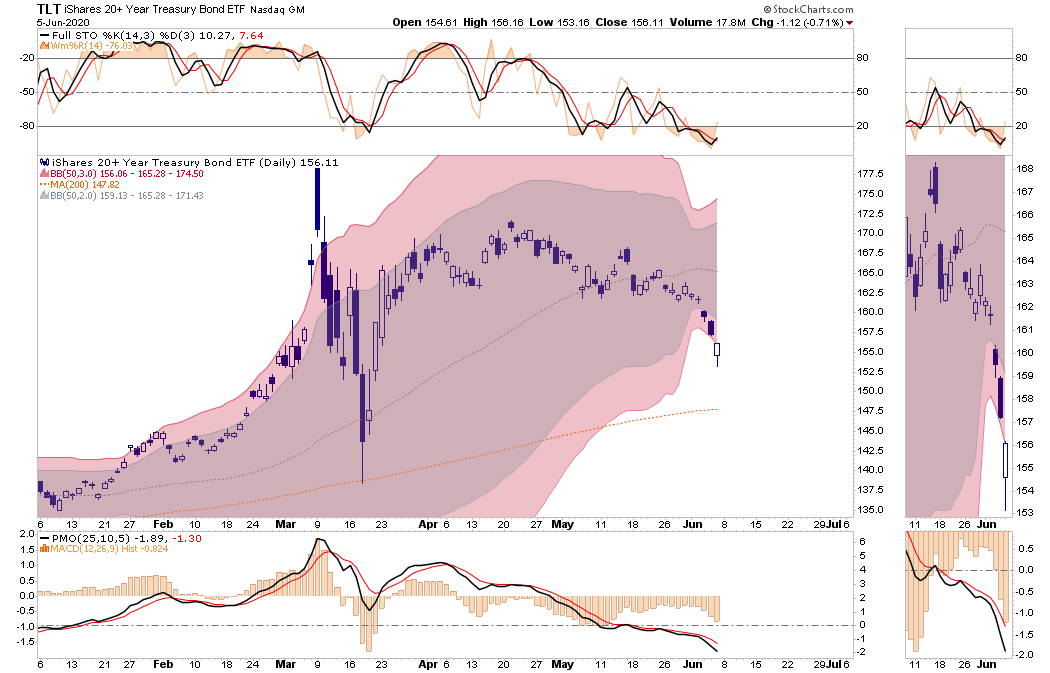
(As opposed to the S&P 500, bonds are more than 3-standard deviations oversold. On Friday, bonds began a reversal rally. We recently added to our positions to take advantage of a risk rotation.)
David Rosenberg adds:
“Even if we get a V-shaped recovery, we are going to be stuck in a deflationary pricing situation for a very long time. You have one-in-five Americans either unemployed or underemployed even after what was apparently a blockbuster jobs report. There is still too much idle capacity to be bidding up inflationary expectations at the moment.
That’s why Treasuries are a very good buy right now.”
Risk Does Not Equal Reward
While the Fed is flooding the system with liquidity, the economic and fundamental backdrop remains a disaster. Fundamental, economic, and earnings growth are substantially weaker, which are dependent on an unemployed consumer. Therefore, we may be required to reverse recent increases in equity risk quickly. However, bond yields are still heading to zero.
It is worth remembering that markets have a very nasty habit of sucking individuals into them when prices become detached from fundamentals. Such is the case currently and has generally not had a positive outcome.
What you decide to do with this information is entirely up to you. As I stated, I do think there is enough of a bullish case, technically, to warrant taking on some equity risk on a very short-term basis. We will see what happens over the next couple of weeks.
However, longer-term dynamics are decidedly bearish. When those negative price dynamics combine with the fundamental and economic backdrop, the “risk” of having excessive exposure to the markets outweighs the potential “reward. “
Remember, investing is not a competition; it is a game of long-term survival.
