In last week’s missive, I discussed a couple of charts which suggested the markets are pushing limits which have previously resulted in fairly brutal reversions. This week, the market pushed those deviations even further as the S&P 500 has now pushed into 3-standard deviation territory above the 200-WEEK moving average.
There have only been a few points over the last 25-years where such deviations from the long-term mean were prevalent. In every case, the extensions were met by a decline, sometimes mild, sometimes much more extreme.
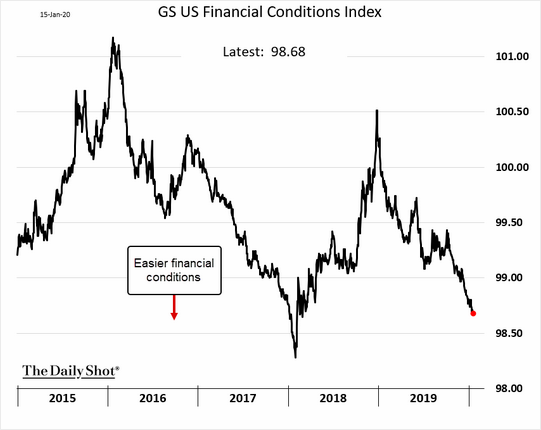
The defining difference between whether those declines were mild, or more extreme, was dependent on the trend of financial conditions. In 1999, 2007, and 2015, as shown in the chart below, financial conditions were being tightened, which led to more brutal contractions as liquidity was removed from the financial system.
Currently, the risk of a more “substantial decline,” is somewhat mitigated due to extremely easy financial conditions. However, such doesn’t mean a 5-10% correction is impossible, as such is well within market norms in any given year.
This is particularly the case given how extreme positioning by both institutions and individual investors has become. With investor cash and bearish positions at extreme lows, with prices extremely extended, a reversion to the mean is likely and could lean toward to the 10% range.

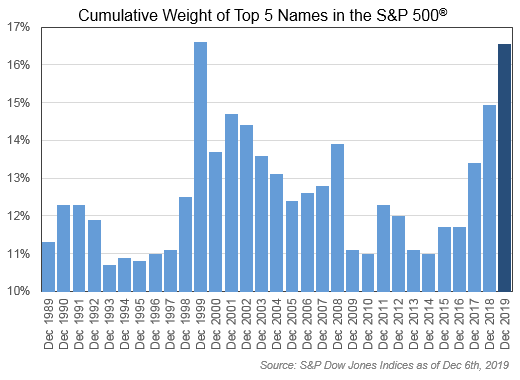
One of the other big concerns remains the concentration of positions driving markets higher. Lawrence Fuller analyzed this particular extreme in the market. (H/T G. O’Brien)
“One similarity between the Four Horseman of 2000 and the mega-caps of 2020 is their tremendous influence on the overall market, as can be seen below by their cumulative weightings. The weighting of today’s top five names is now 17.3%. I’m not suggesting that history is going to repeat itself, but often it rhymes.
If you lived and invested through the 1990s, as I did, then you’ll understand what I am talking about when I say that the dot-com boom was a sentiment-driven rally. I’m starting to see the same explanation for the current rally, as there really haven’t been any concrete fundamental developments to explain or validate it. The momentum stocks are rising in price day after day on hopes and expectations, and Wall Street analysts are happy hop on board for the ride, as usual.”
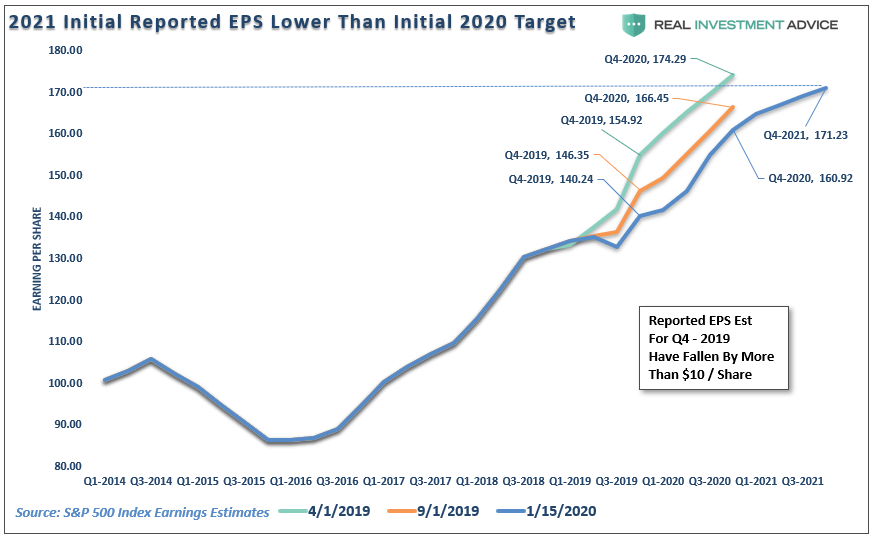
Lawrence is correct. There has not been a fundamental improvement to support the rise in the market currently. As shown in the chart below, S&P just released its 2021 estimates for the S&P 500, which is estimated to come in at $171/share.
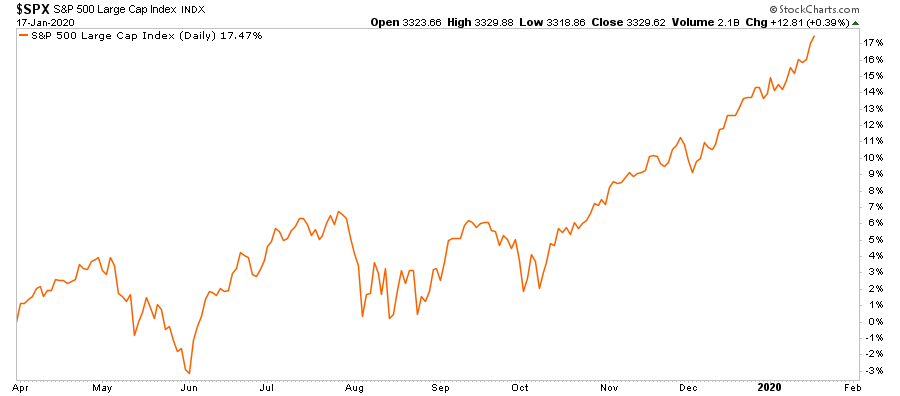
What you should notice is that estimates for 2021 are now $3 LOWER than where estimates for the end of 2020 stood in April 2019. Importantly, between April 2019 and present, as earnings estimates were continually ratcheted lower, the S&P 500 index rose by 17.5%
While Apple (NASDAQ:AAPL), which we own, is the “cheapest” of the “4-horseman” currently, it is only “cheap” because of rather aggressive share repurchases. Here are some interesting stats:
In the 5-years from 2015:
However, during that same 5-year period, Apple’s share price has risen by 210%.

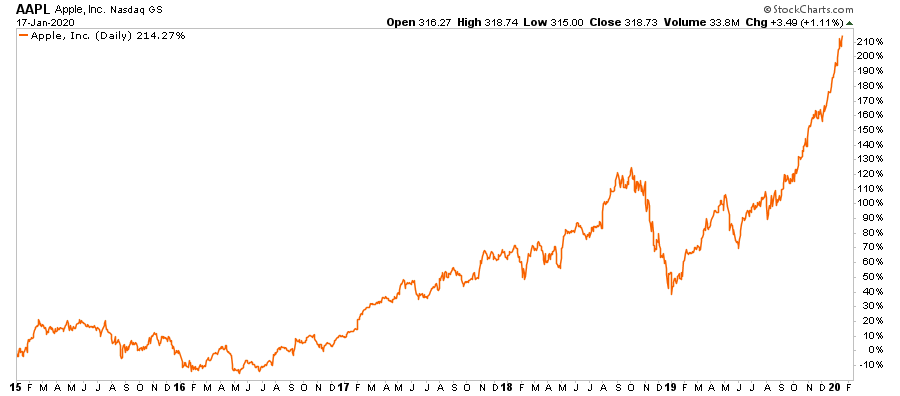
So why do we still own Apple? Because “fundamentals don’t matter” currently as the momentum chase, fueled by the Fed’s ongoing liquidity interventions, has led to a “runaway train.” But, understanding that eventually fundamentals will matter, is why we have taken profits out of our position twice since January 2019.
The only reason Apple “appears” to be cheap is because of the massive infusion of capital used to reduce the number of shares outstanding. As a business, it is a great company, but it is a fully mature company, which is struggling to grow revenues. With a P/E of 27 and price-to-sales (P/S) ratio of 5.36, investors are grossly overpaying for the earnings growth and will likely be disappointed with future return prospects.
Just remember, “price is what you pay, value is what you get.”
Next Stop, 3500
As noted last week, in July of 2019, we laid out our prognostication the S&P 500 could reach 3300 amid a market melt-up though the end of the year. On Friday, the S&P 500 closed at 3329, with the Dow pushing toward 29,350.
With the Federal Reserve continuing to pump liquidity into the market currently, we are raising our 2020 estimate for the S&P to 3500 as “the mania” goes mainstream. There is absolutely NO FUNDAMENTAL basis for raising the target; it is ONLY a function of the momentum chase.
This urgency to take on “risk,” as investors pile into “passive indexes” under a “no market risk” assumption, can be seen in the extreme lows of the put/call ratio.
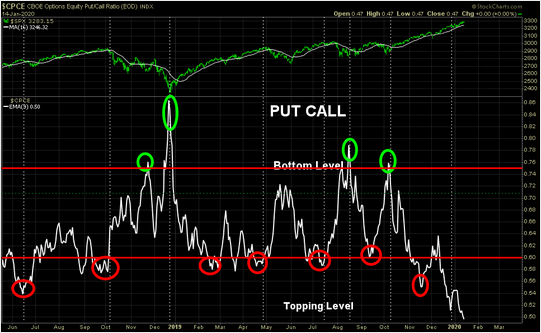
With the Federal Reserve’s ongoing “Not QE,” it is entirely possible the markets could continue their upward momentum towards S&P 3500, and Dow 30,000. Clearly, the “cat is out of the bag” if CNBC even realizes it’s the Fed:
“On Oct. 11, the central bank announced it would begin purchasing $60 billion of Treasury bills a month to keep control over short-term rates. The magnitude of the purchases resembles the quantitative easing program the Fed conducted during and after the financial crisis.”
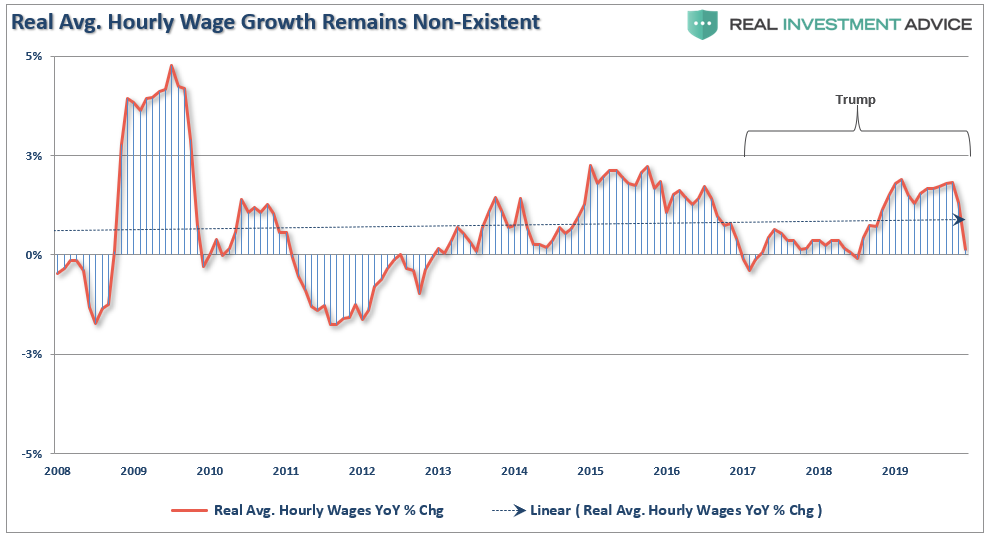
With the Federal Reserve continuing to “ease” financial conditions, there is little to derail higher asset prices in the short-term. However, we continue to see cracks in the “economic armor,” like Friday’s plunge in “job openings,” continued deterioration in earnings estimates, weaker growth rates in employment, and negative revisions to data, like wages, which suggest the market is well ahead of the economy. (Last week, negative revisions wiped out all the wage growth for the bottom 80% of workers.)
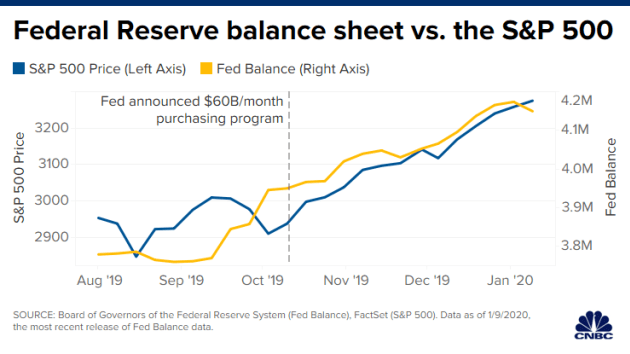
“The increase in the Fed’s balance sheet has been in near lockstep with the stock market’s climb. The balance sheet has expanded 10% since October, while the S&P 500 shot up 12%, including notching its best fourth quarter since 2013.”
But, as I said, “fundamentals” don’t matter currently. As CNBC noted:
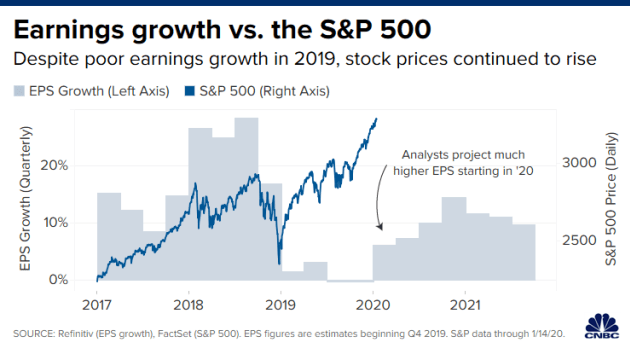
“The problem front and center is how investors are looking past the continuous earnings rout, betting on a snapback as soon as the first quarter of 2020. S&P 500 earnings are expected to drop by 0.3% in the fourth quarter of 2019, marking the first back-to-back quarterly decline since 2016, according to Refinitiv.”
While “fundamentals” may not seem to matter much currently, eventually, they will.
Portfolio Positioning
After reducing exposure “slightly” to equities, as noted last week, we did not make any further changes to portfolios over the last few days. Given we have shortened our duration in our bond holdings, raised cash levels to roughly 10% of the portfolio, we can afford at the moment to allow our existing long positions to ride the market higher.
In case you missed last week’s note, or are a new reader, here were the previous changes:
In the Equity Portfolios, we slightly reduced our weightings in some of our more extended holdings such as Apple (NASDAQ:AAPL,) Microsoft (NASDAQ:MSFT), United Healthcare (UNH), Johnson & Johnson (NYSE:JNJ), and Micron (NASDAQ:MU.)
In the ETF Sector Rotation Portfolio, we slightly reduced our overweight positions in Technology (XLK), Healthcare (XLV), Mortgage Real Estate (REM), Communications (XLC), Discretionary (XLY) back to portfolio weightings for now.
The reason we continue to derisk portfolios is that we have seen this “game” before.
The Dynamic Portfolio was allocated to a market neutral position by shorting the S&P index itself.
“The belief the markets can no longer have a correction is fueling an equity chase in companies with the poorest underlying fundamentals. The last time that we saw asset prices surge by 20%, or more, in a single month, particularly in companies with no revenue, negative valuations, and poor business models, was in 1999. The chart of Qualcom (QCOM) in late 1999 is a good example.”
“Unfortunately, for investors in QCOM, by the end of 2000, that 95% gain had been reversed to a 10% loss. But QCOM was not alone, the only difference is the vast majority of other companies like Global Crossing, Enron, Worldcom, Lucent Technologies, Sun Micro, and many others, no longer exist in their original forms, if at all.
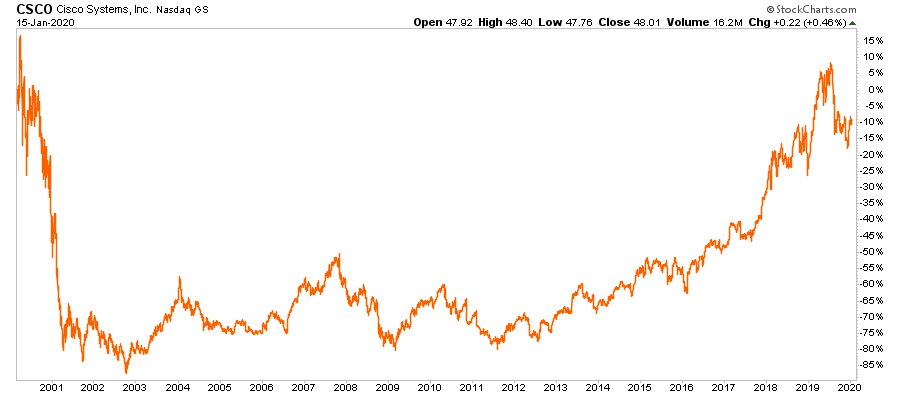
Another good example is Cisco Systems (NASDAQ:CSCO). If you had bought it at the turn of the century, you would still be down 10% in your position 20-years later.”
“Today, we are seeing the same chase in companies which exhibit similar characteristics to what we saw in 1999:
Sure, companies from Tesla (NASDAQ:TSLA) to Zoom Video (NASDAQ:ZM) might just be the next Amazon (NASDAQ:AMZN) of the “dot.com” mania to survive and prosper. However, the odds are highly stacked against that being the case.”
Being more conservative may “cost” you in the short-term. However, in the longer-term, where it matters for your money, it is highly likely we will eventually see some, most, or all of the gains of this past decade reversed.
While that is hard to believe, just remember its happened twice before.
