Last week’s news was filled with stories about how the FANG stocks and particularly Apple (NASDAQ:AAPL) were the main driving forces behind the new highs in the indexes and their ETFs (i.e. SPY and QQQ).
The tone of this type of news is generally negative and dismissive toward the validity of the bull market. The same attitude is prevalent concerning the mega-cap tech names being the only reason the market is up. The argument then follows that there aren’t any other bullish areas of the market, and therefore we should expect a top.
I understand the frustration of a few stocks having extraordinary influence in the market indexes value. I felt this disappointment on Friday when I excitedly discovered an Industrial Index that closed over its Thursday high, creating a breakout of a bullish flag.
This is exactly what I’m keen on finding right now, “cyclical” ideas that could be a source of new trend continuation trades when the mega-cap tech names need a rest.
Unfortunately, the Industrial index I was excited about was the Dow, which has, as one of its components, APPL.
According to Barron’s, The Trader column, AAPL’s 8.2% move this week was responsible for adding 260 points to the Dow and was responsible for 60% of the S&P 500’s rise of 0.7%.
As a result, the Dow isn’t the industrial exposure I’m looking for.
The strength in the mega-cap tech stocks is a reason for the magnitude of the market’s rally.
As you’ll see below, this influence has become even more glaring since July.
As a result, when your trading the DIA, SPY, QQQ, and certain other ETFs, it’s important to understand the game you’re playing, but they have not been the only game in town.
Key areas of interest from Big View:
- SMH losing leadership strength on the daily Triple Play indicator
- QQQ is at the top of a channel that marks 4 of the last 5 short-term tops
- “What’s Hot List” for the week includes XHB, UNG and FXI (and QQQ of course)
- Adv/Decline lines and McClellan Oscillators in SPY and NASDAQ have been unusually weak over the last 10 days considering the market has not sold off.
- SPY Risk Gauge remains bullish
- % of S&P 500 over their 50 DMA has dropped significantly in the last week
- IWM closed below its 10 DMA for 2 consecutive days
Three of the seven points above are about weakening market breadth.
However, they are short-term concerns and not necessarily long-term problems.
I find the advance-decline (AD) data to be helpful for short-term timing, but for longer-term analysis, I will considerer it as a confirmation of a trend rather than a warning of a reversal.
The current situation is a good example.
Below is a chart of the SPY, the AD line, and the equally weighted S&P 500 ETF (RSP).
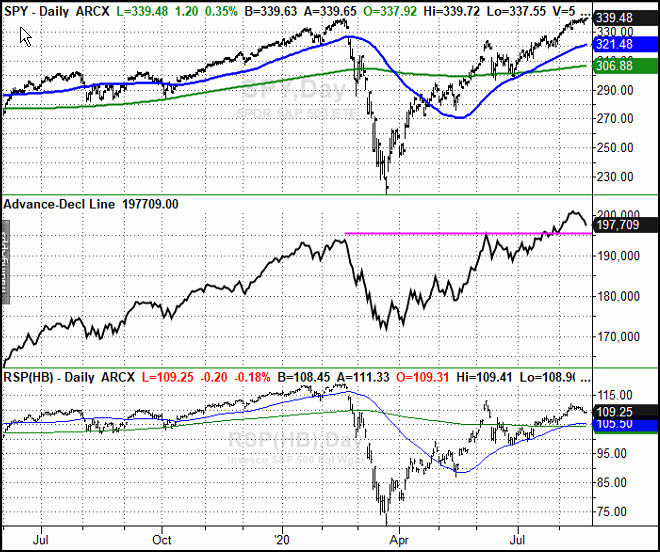
You can see in the chart below that RSP had a very similar pattern upward as the SPY until July. Since July, the SPY has run to new highs as the RSP rally has slowed down.
You may be surprised to see that the AD made new highs before the SPY.
The “problem” with this market isn’t that it doesn’t have good breadth since the March low. RSP, the long-term AD uptrend, and the sector analysis below all show that the recovery has occurred in more than a few names.
I would agree that the extent to which the QQQ has exceeded it’s February highs seems unrealistically optimistic, but doesn’t mean that there aren’t other stocks participating.
The problem the market faces is that the stocks that were rallying on expectations of an economic recovery have slowed down.
There are two major themes driving the trend in the indexes:
1. A struggling economy with COVID-19 restricting and changing our behavior
2. A recovering economy with the COVID-19 risks going away
The market recovered so quickly because both stocks in both themes rallied.
Since July, the stocks that will profit in both environments pushed the market higher.
If these stock selloff, the indexes will likely be under pressure due to their weighting in the indexes. However, there is a scenario where the indexes could look weak or stalled as the mega-cap techs correct, meanwhile other stocks and sectors enjoy their own bull markets.
This is the scenario of an economy improving and the COVID-19 risks going away.
If the economy spirals downward, both themes rollover into bear markets.
Rather than focusing on what the major indexes are doing, it’s more important than ever to focus on what these two themes are doing by watching certain industry groups and individual stocks.
Additionally, when the mega-cap tech rally stalls, it will be important to follow the market’s rotation. More specifically, look to see if money flows into recovery sectors and stocks or out of stocks altogether? One way to do this is by watching the sectors, as I will describe below.
But first, when will this rally stall?
The market’s short-term breadth readings combined with the channel in the QQQ chart below suggest it could be soon.
The most glaring example of the difference between price action and breadth is in the QQQ chart below, with its cumulative advance-decline line dropping during the entire rally from the August 11th low.
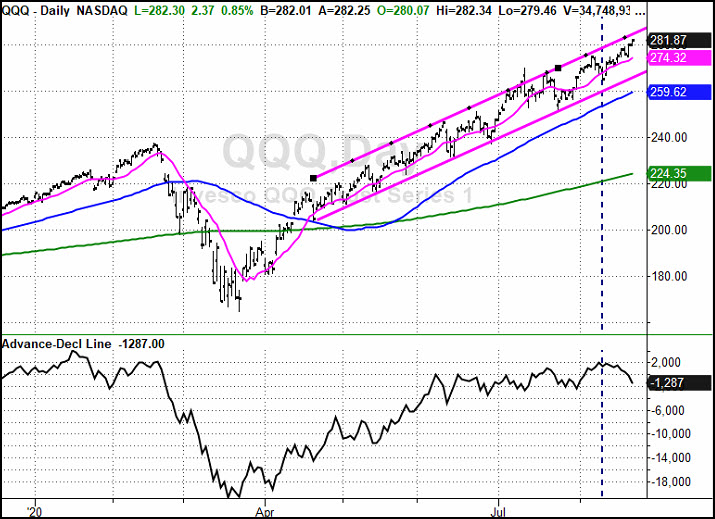
I couldn’t visually find a situation in recent history where the market rallied or consolidated while the AD line fell so consistently over a 7-day period (marked by the dotted line).
Bearish? Maybe, but when?
The channel in the chart above suggests the market is stretched, but..
When I try to identify a long or short-term market top, I wait until the price action begins to get weak.
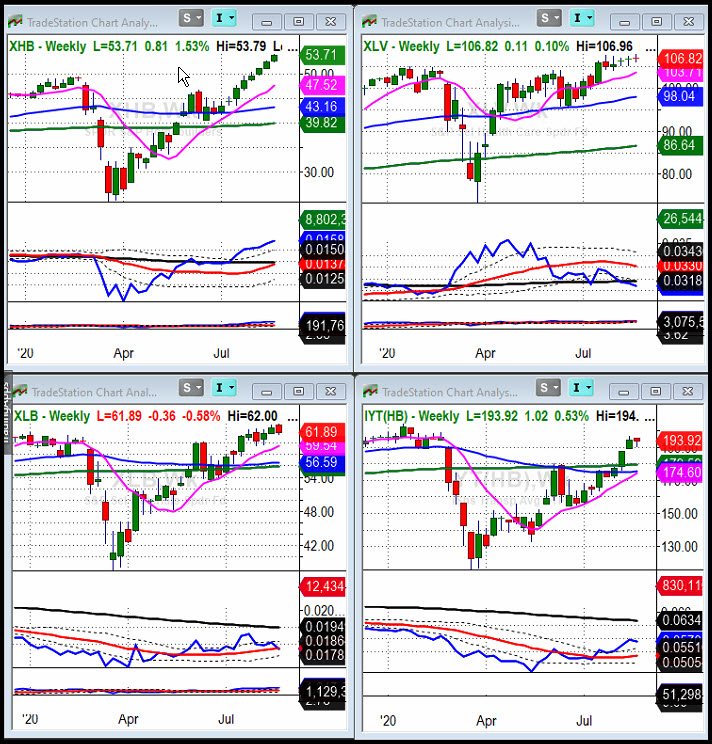
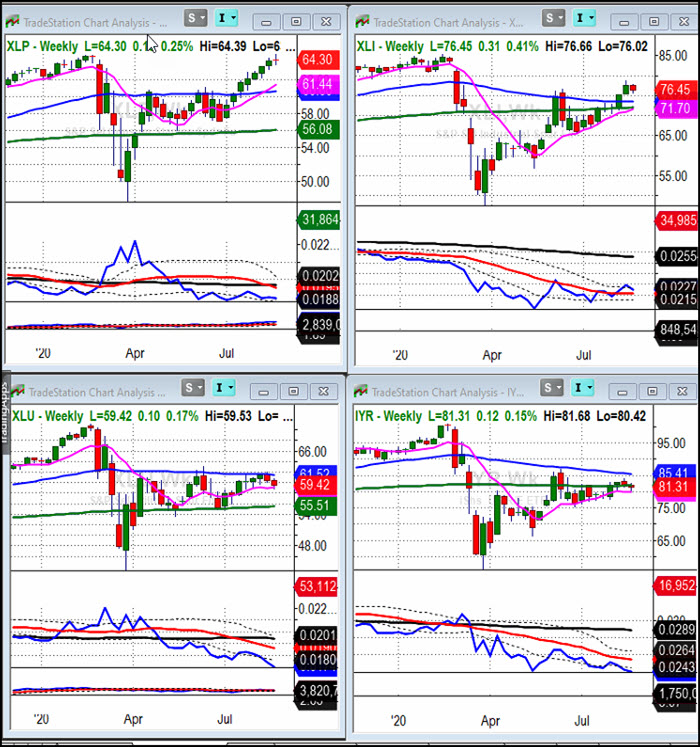
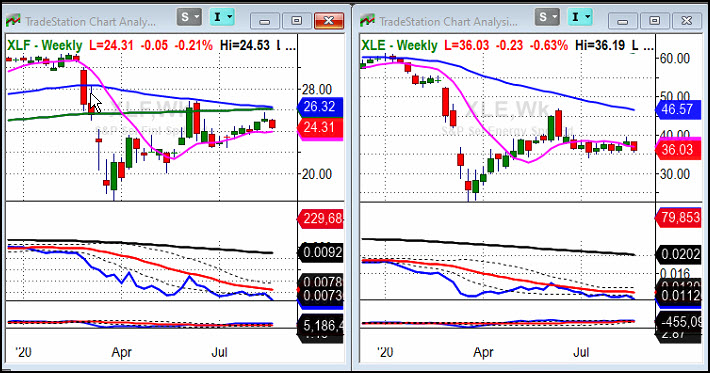
The fact that the majority of the sectors in the table below are in a bullish phase and positive on a 6-month basis is a strong indication of market breadth, and a reason to believe that a correction in the mega-cap leaders could result in a healthy rotation if the recovery theme remains intact.
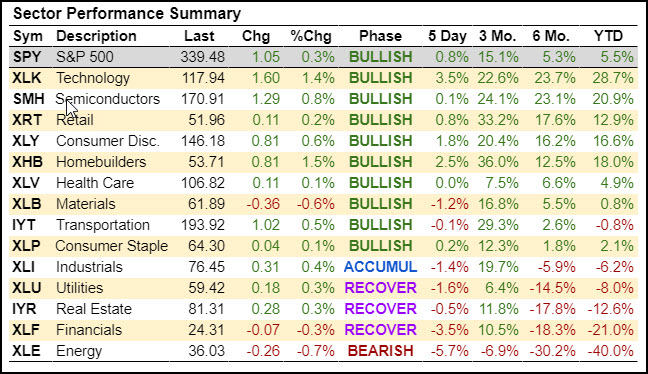
In addition to the 6-month strength, the next measure of market breadth I’m looking at is how many of these sectors are trading over their Feb. 2020 highs.
When this market corrects, these are the sectors that will be the best candidates for buying during the correction.
If there were only a few I’d be concerned, but 7 of 14 are trading over their February highs, and I would not have expected that many in such a short time.
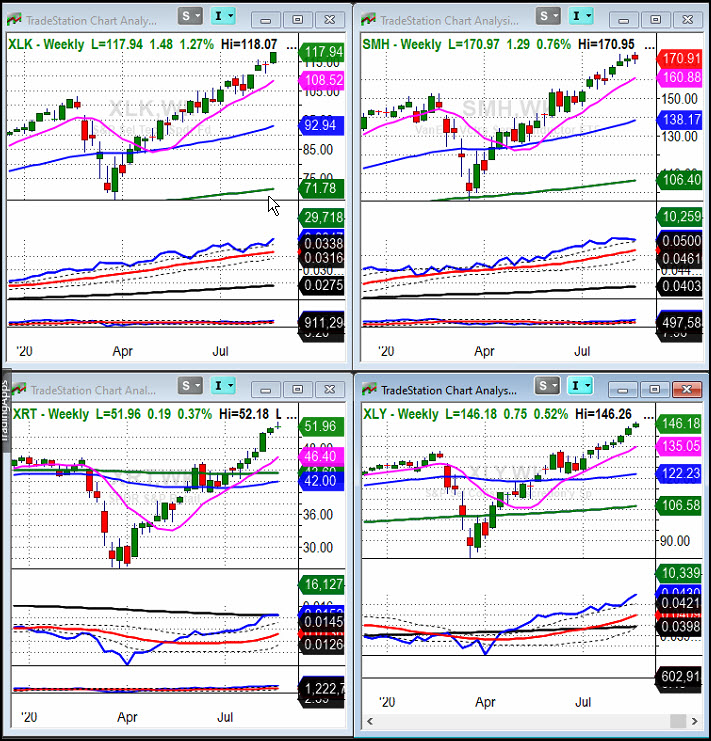
In addition, you’ll see the charts have our Triple Play Leadership line on them.
When the blue line is over the red line its bullish, and 7 are bullish. You may also find it interesting to see when each of the sectors turned bullish by this measure during and after the 2020 crash.
In the context of understanding which indexes or ETF’s may be influenced by a few stocks, I’ve listed the stocks that are either the largest holding or over about 10% of each ETF.
XLK (Technology): MSFT 22%, AAPL 21%
SMH (Semiconductors): TSM 12%, INTC 9%, NVDA 8%
XRT (Retail): OSTK 2%
XLY (Consumer Discretionary): AMZN 23%, HD 13%
XHB (Home Builders): TREX 4%
XLV (Healthcare): JNJ 10%
XLB (Materials): LIN 17%
IYT (Transportation): NSC 11%, UNP 11%, KSU 9%, FDX 9%
XLP (Consumer Staples): PG 16%, PEP 10%, KO 10%, WMT 10%
XLI (Industrials): UNP 6%
XLU (Utilities): NEE 15%
IYR (Real Estate): AMT 10%
XLF (Banks): BRK.B 13%, JPM 11%
XLE (Energy): CVX 23%, XOM 23%
Clearly, XLK and XLY will be weighed down if the mega-cap tech stocks selloff. So when that happens, the bullish rotation would be for XLY to not selloff if AMZN does, and for XRT, XHB, XLV, XLB, IYT, XLP, and XLI to hold up or even rally.
Additionally, keep your eye on RSP. While I would not expect it to rally during a correction in SPY or QQQ, a 5% correction that holds its 50 and 200 DMA would be healthy.
Of course, this rotation could also happen without a selloff in the market. That would be even more bullish.
Which stock should you buy in your very next trade?
AI computing powers are changing the stock market. Investing.com's ProPicks AI includes 6 winning stock portfolios chosen by our advanced AI. In 2024 alone, ProPicks AI identified 2 stocks that surged over 150%, 4 additional stocks that leaped over 30%, and 3 more that climbed over 25%. Which stock will be the next to soar?
Unlock ProPicks AI