- Uneven economic data and better-than-expected, but severely lowered corporate profits paint an unclear path for equities
- Near record lows for yields, fresh record for gold, VIX that won’t close the gap, provide negative divergence to record high equities
- The DJIA completes a bullish pattern
After US housing data and PMI releases bolstered the argument that an economic recovery from the COVID-19 induced recession was underway, most stocks advanced Friday, led by the tech sector. The S&P 500, Dow Jones Industrial Average and NASDAQ Composite all climbed for a second day. The moves sealed a fourth straight week of gains for the indices—the longest winning streak for the tech-heavy index since January and for broader SPX since December.
We're expecting more of the same for the coming week.
Tech Shares Outperforming On All Time Frames
Thanks to Technology, the two indices outperformed. Among the S&P 500’s 11 sectors, it provided the strongest returns on the day, +1.27%, well ahead of runner up, Consumer Discretionary’s 0.5% advance. Indeed, tech stocks have been outperforming on any and every time frame: daily, weekly, monthly, 3-months, 6-months, YTD, yearly and 5-years.
The old-normal reason for the technology outperformance is, “it's the future.” In a pandemic fueled environment, in which people spend more time at home, it makes sense companies within the sector would be seeing greater demand as their products and services replace the physical world.
Thanks to technology, both benchmarks scored fresh records on Friday. It was the second post-coronavirus record for the S&P 500 and 14th record close for the NASDAQ, its 36th record high for the year—21 of which were notched post-pandemic.
To put that into perspective, the NASDAQ Composite hit 19 records since the March lows, or 10 ½ times more all-time highs post-pandemic. That fact seems to suggest that the current rally is directly attributable to the sector’s advantage during a period of social distancing and arguably a permanently changing world 'order,' rather than merely the generic “future.”
Which would perhaps then also explain why small caps have been the great underperformers. Right now, the Russell 2000 is over 12% below its Aug. 31, 2018 record, while the Dow Jones is just 5.9% below its Feb. 12 record, and the S&P 500 and NASDAQ have already achieved fresh records, for the NASDAQ multiple times.
Economic data and corporate profits published last week may have pointed to economic recovery, albeit one that's uneven. Existing home sales jumped the highest ever in July, buoyed by low mortgage rates and little inventory. Big name retailers such as Walmart (NYSE:WMT) and Target (NYSE:TGT) posted surging profits during the pandemic.
The real question, however, is, will they make up for all the smaller retailers that have been decimated? As of now, unemployment remains high, and government-funded virus relief in the US is at a stalemate.
Equally distressing: while in the past it's historically taken four years for stocks to recover to a peak following a bear market, this time it took the S&P 500 just six months to hit a new record. This may indeed seem impressive, however, it’s important to frame it in context: the swift new record occurred after the fastest bear market on record.
More than a decade of QE and other economic experimentation has placed us in a brave new world, in which we can’t really know where we’re heading. Whatever we've learned about the economy and the financial markets previously may no longer be relevant. It could be that we'll need to relearn everything.
For example, Warren Buffet, the most admired stock picker of all time, dumped equities when the pandemic hit. The famous dip buyer gave a pass to bargains galore. Why? The “Oracle of Omaha” now says he does not know what will happen in the stock market.
Despite the better-than-expected corporate profits, they’re still 40% lower than a year ago, prior to the coronavirus lockdowns. Moreover, analysts expect profits on S&P 500 listed companies to fall a further 14.5% over the next 12 months.
Additionally, a variety of negative divergences to record-breaking equities are now in effect: the VIX has yet to drop to pre-COVID levels; yields are 93 basis points lower and gold hit a fresh high for the first time since 2011.
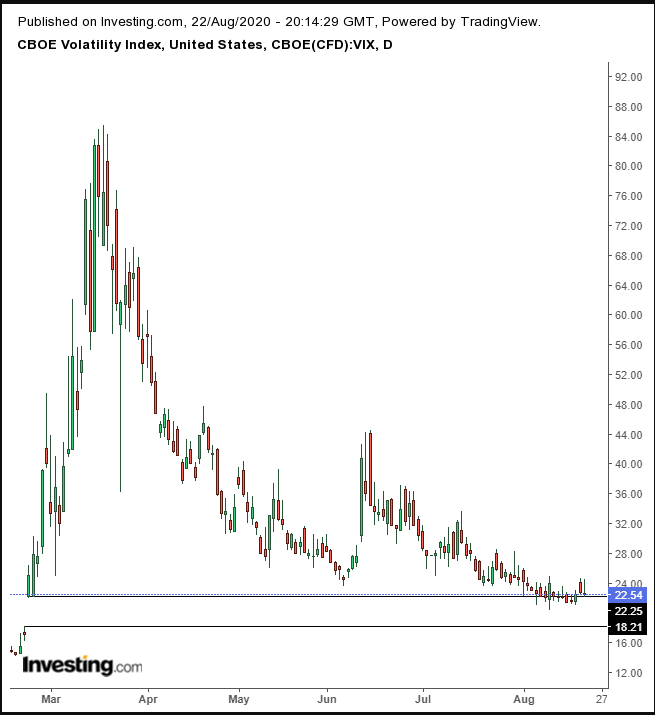
The VIX seemed to have find support by the rising gap the virus created, as the fear-gauge rounds up again.
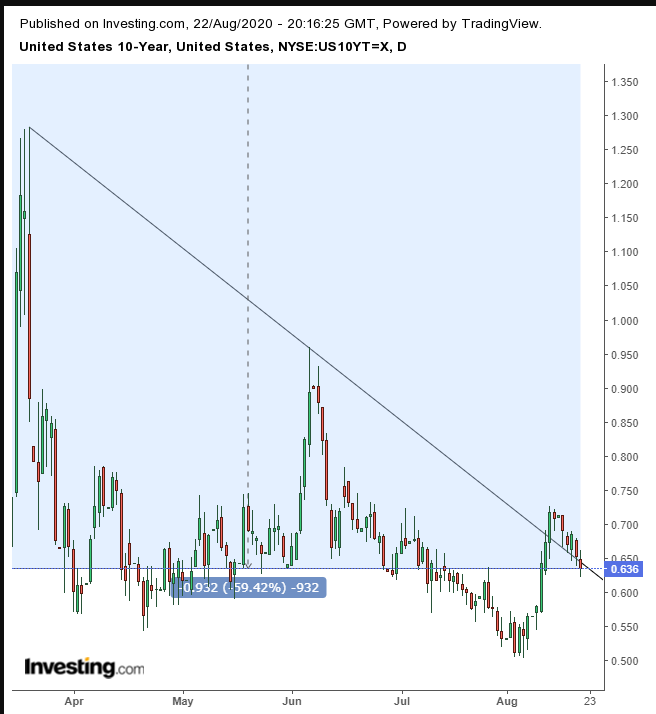
Yields, including for the 10-year note, have fallen back below an uptrend line since the Feb. 20 high, before the virus pushed rates lower. All told, yields are down 93 basis points.
Gold is down 5.25% after posting its record close, and investors have some tough decisions to make.
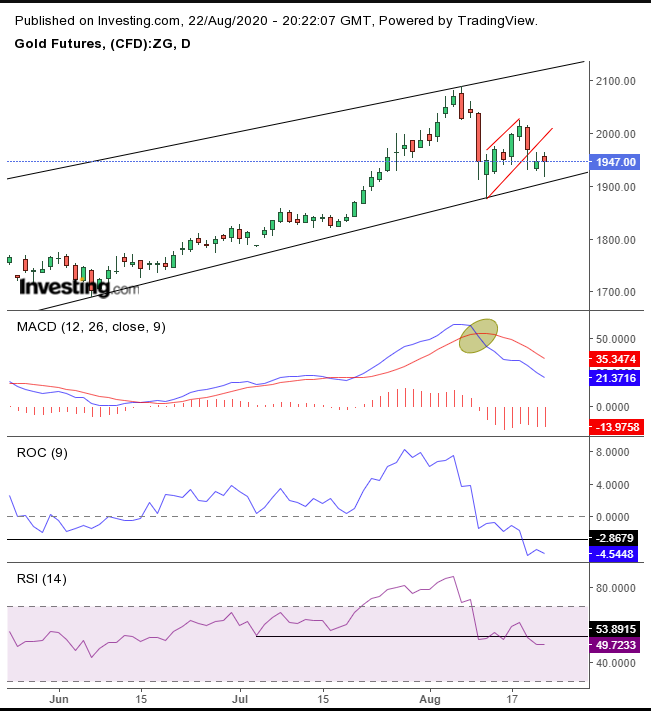
While the precious metal remains within it’s rising channel—and Friday’s hammer confirms Thursday’s inverted hammer with both reinforcing Aug 12th’s hammer—gold may have just completed a rising flag, bearish after the 10.3% plunge in only four sessions, from Aug. 7 through 12. The MACD, the ROC and the RSI all suggest the price of the yellow metal may be topping out.
Should gold follow through with this bearish scenario, it may confirm the bullish flag the Dow Jones completed on Friday.
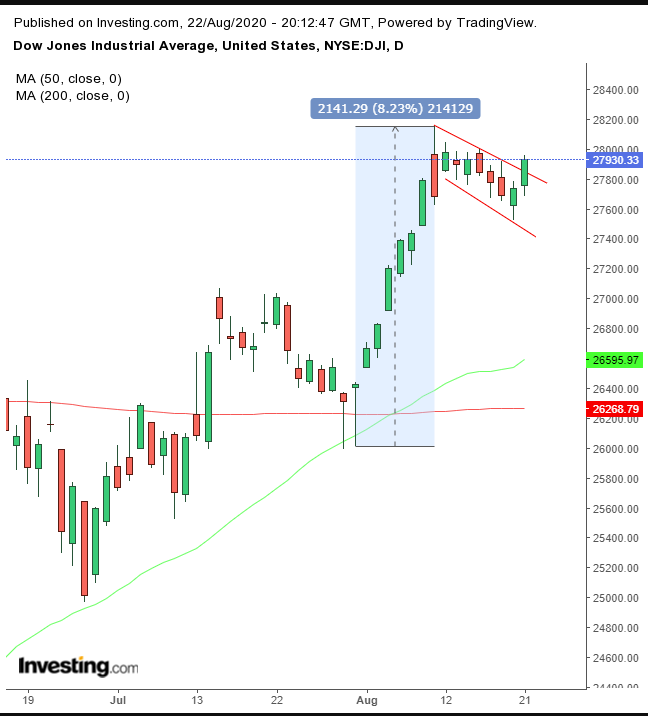
The Dow provided a mild upside breakout of a rising flag, bullish after the more-than 2,000-point jump within eight sessions, which triggered a Golden Cross. If the breakout remains, market dynamics are presumed to then take the Dow to test record highs.
As the ultimate safe haven currency, the dollar jumped Wednesday after the Fed's gloomier than expected minutes, then also jumped Friday on optimism concerning a recovery. In other words, the market narrative is now attributing dollar strength to two conflicting themes, in the course of just two days. We'll offer one technical explanation that's more consistent:
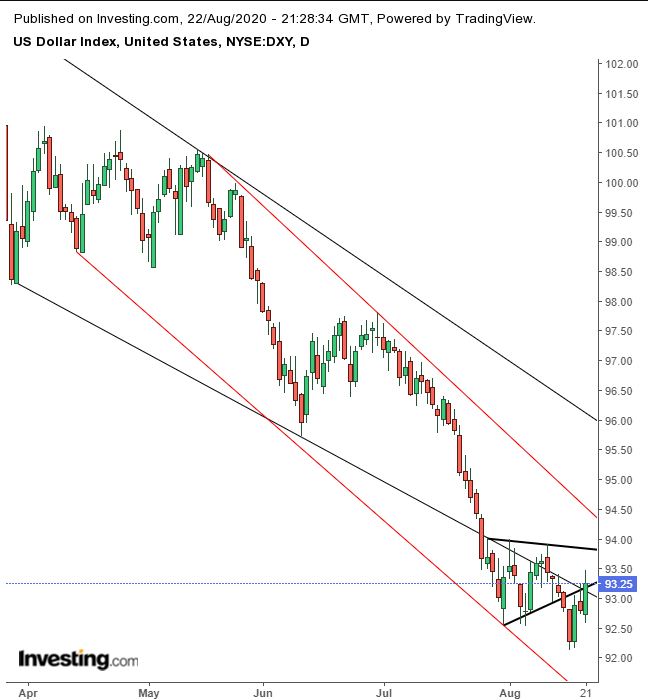
The dollar completed a bearish pennant, after having dropped below its falling channel since the March peak, creating the trading dynamics for a steeper channel (red). The dollar rally is considered a return move to retest the pattern. Lo and behold, the pattern held, increasing the likelihood of a continued descent.
Saudi Arabia’s crude oil exports dipped to record lows in June, and Russia overtook the Desert Kingdom as the world's second largest oil producer.
The oil market is another negative divergence to record high equities, as the energy commodity has been lethargic for 11 weeks. Still, WTI managed to push higher by 0.8% last week, to cap its third weekly rise in a row, even amid volatility, gaining 5.1%
The Week Ahead
All times listed are EDT
Tuesday
4:00: Germany – Ifo Business Climate Index: expected to rise to 92.0 from 90.5.
10:00: US – CB Consumer Confidence: seen to edge higher to 93.0 from 92.6.
10:00: US – New Home Sales: likely increased to 786K from 776K.
Wednesday
8:30: US – Core Durable Goods Orders: predicted to plunge to 2.1% from 3.6%.
10:30: US – Crude Oil Inventories: came in last week at -1.632M.
Thursday
8:30: US – GDP: expected to crawl up to -32.6% from -32.9% QoQ.
8:30: US – Initial Jobless Claims: to fall to 925K from 1,106K.
9:10: US – Fed Chair Powell Speaks
10:00: US – Pending Home Sales: forecast to plunge to 4.5% from 16.6%.
Friday
9:05: UK – BoE Gov Bailey Speaks
