✂ Fed’s first rate cut since 2020: Use our free Stock Screener to find new opportunities fastExplore for FREE

Long-Term Bullish In 3 Charts

Published 08/01/2017, 12:24 PM
Updated 07/09/2023, 06:31 AM
US500
-
DJI
-
IXIC
-

Markets In Conflict

According to stockcharts.com, trading ranges speak to a fairly even battle between stock-market bulls and bears:

Price action depicts a market in conflict. Only until the price breaks above resistance or below support will it be clear which group has won the battle.

As shown via the 1981-2013 S&P 500 chart below, neither the bulls nor the bears made much sustainable progress between 1996 and 2013, which resulted in a long-term trading range.

S&P 500

Worth A Thousand Words

The S&P 500 broke above prior resistance in 2013, meaning the bulls won the long-term battle that took place between 1996 and 2013. The lows in 2015 and 2016 served as a retest of the 2013 breakout.

S&P 500

Where Does The Average Stock Stand?

Has the average stock broken above long-term resistance? This week’s video uses present day market fractals to help assess the outlook beyond the major U.S. stock indexes. Some fascinating market fractals have formed over the past 35 years, which may have a significant impact on stock market behavior over the next 20 years.

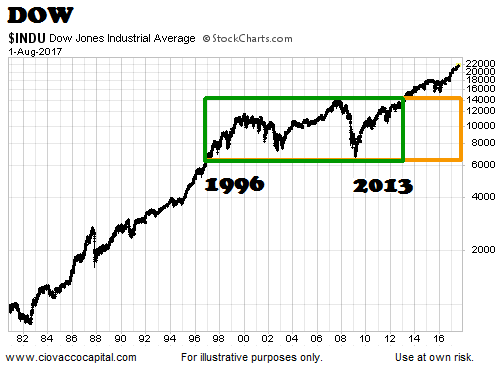
Dow Jones Industrial Average

The Dow entered the box in 1996 and remained there until the breakout in 2013.
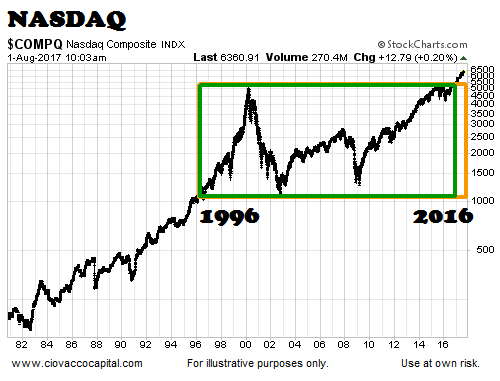
NASDAQ/Tech Stocks

In 2016, the NASDAQ completed the trifecta by breaking above resistance that dated back to the highs made at the peak of the dot-com hysteria.

2017 And Beyond

From a short- and intermediate-term perspective, markets will always be volatile and challenging. However, given what we know today, the charts above tell us the odds favor good things happening over the next 5 to 20 years. Therefore, under our approach, we will continue to give the long-term trends the benefit of the doubt as long as they remain in place. The closer we watch the markets and our account balances, the more difficult it will be to stay focused on the longer-term, and bullish, outlook.

Latest comments

Loading next article…
Risk Disclosure: Trading in financial instruments and/or cryptocurrencies involves high risks including the risk of losing some, or all, of your investment amount, and may not be suitable for all investors. Prices of cryptocurrencies are extremely volatile and may be affected by external factors such as financial, regulatory or political events. Trading on margin increases the financial risks.
Before deciding to trade in financial instrument or cryptocurrencies you should be fully informed of the risks and costs associated with trading the financial markets, carefully consider your investment objectives, level of experience, and risk appetite, and seek professional advice where needed.
Fusion Media would like to remind you that the data contained in this website is not necessarily real-time nor accurate. The data and prices on the website are not necessarily provided by any market or exchange, but may be provided by market makers, and so prices may not be accurate and may differ from the actual price at any given market, meaning prices are indicative and not appropriate for trading purposes. Fusion Media and any provider of the data contained in this website will not accept liability for any loss or damage as a result of your trading, or your reliance on the information contained within this website.
It is prohibited to use, store, reproduce, display, modify, transmit or distribute the data contained in this website without the explicit prior written permission of Fusion Media and/or the data provider. All intellectual property rights are reserved by the providers and/or the exchange providing the data contained in this website.
Fusion Media may be compensated by the advertisers that appear on the website, based on your interaction with the advertisements or advertisers.
© 2007-2024 - Fusion Media Limited. All Rights Reserved.