Apple, Microsoft, Amazon, Facebook and Google (Alphabet) account for roughly 13% of the SPDR S&P 500's (NYSE:SPY) price movement. The same 5 corporations? 42% of the NASDAQ 100’s price appreciation.
The super-sized weighting of prominent tech companies in these benchmark ETFs has resulted in year-to-date gains of 7.1% and 16.6% respectively. Yet the rest of the market’s performance has been flat. Barely positive, in fact.
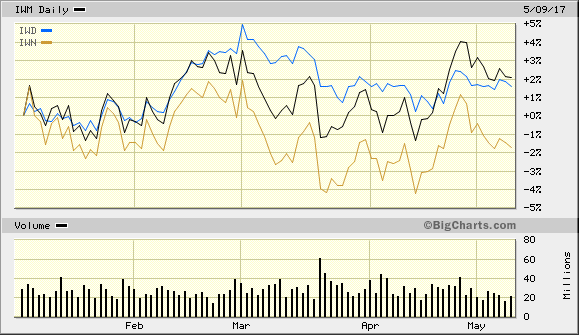
Not sure? Take a look at the performance of small-cap and value-oriented proxies like iShares Russell 2000 (NYSE:IWM), iShares Russell 2000 Value (NYSE:IWN) and iShares Russell 1000 Value (NYSE:IWD). Positive momentum has been eroding since the end of February.
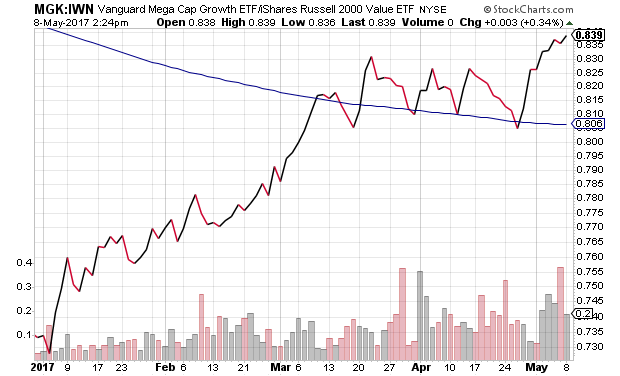
Another way to visualize the difference is through a price ratio. The Vanguard Mega-Cap Growth ETF (NYSE:MGK):iShares Russell 2000 Value (NYSE:IWN) price ratio demonstrates the enormous investor interest in the largest growing company’s shares as opposed to interest in small, yet reliable revenue producers.
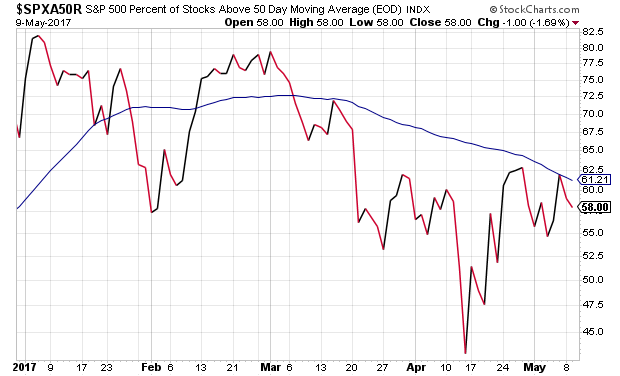
By some measures, the enthusiasm for U.S. stocks in the S&P 500 itself has been deteriorating since the beginning of 2017. The number of S&P 500 constituents in a near-term uptrend (50 days) near the star of the year was 82%. Today? 58%.
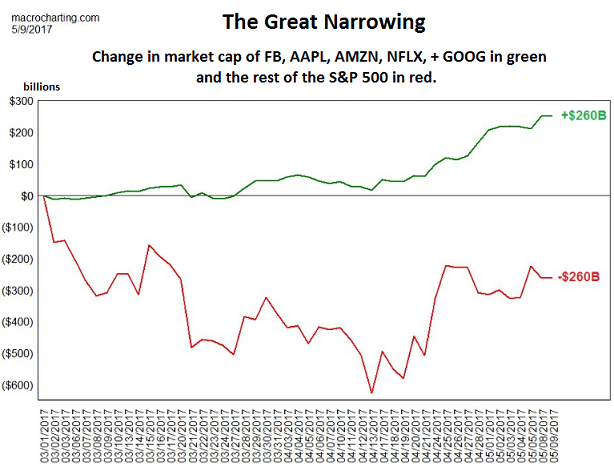
In truth, since the end of February, the entire market is being held up by a handful of large-cap tech names. One analysis demonstrates how five stocks in the S&P 500 account for $260 billion in market gain since March 1, while the other 495 components collectively lost $260 billion in market value. The primary beneficiaries? The ever-popular quintet of Facebook, Apple, Amazon, Netflix (NASDAQ:NFLX) and Google, known as “FAANG.”
Granted, many folks do not care whether the breadth of the overall market is breaking down, as long as the index that they own is pushing all-time record highs. Others, myself included, consider the strong possibility that atrocious financial loss will result from the over-leveraged ownership of “FAANG,” extraordinary stock overvaluation and unusual investor complacency.
Stock overvaluation is particularly egregious in the small company arena. If we recognize that, since the Fed began raising its overnight lending rate in December of 2015, the aggregate price-to-earnings ratio (P/E) of the Russell 2000 has moved up from 46 to 115. Is economic growth going to catapult higher to justify it? When nearly one-third (32%) of the small-cap benchmark is comprised of companies that do not even turn a profit?
I wish we could say that large-caps are immune from the silliness. Alas, I cannot.
The Enterprise Value/Sales measure for the median S&P 500 component is 25% GREATER THAN it was at the height of the infamous tech bubble in 2000; in fact, EV/Sales for the median S&P 500 stock is 48% above the 35-year average. Yikes! Keep in mind, of course, that revenues are far more reliable than estimated corporate earnings or actual 12-month earnings because sales are far more difficult to manipulate through non-standard accounting practices.
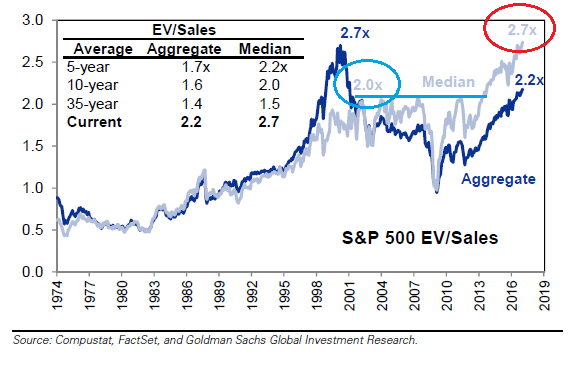
There’s more. With 84% of corporations reporting, the S&P 500 GAAP-based earnings in the most recent quarter (3/30/2017) comes in at $100.92. S&P 500 GAAP-based earnings three years earlier (3/30/2014)? Nearly identical at $100.85.
It is difficult to imagine, then, why investors would eagerly pay close to 2400 to own the index today at a P/E of 23.8 when the same earnings three years ago had been associated with 1875 and a P/E of 18.6. That’s a 22% premium above 2014 prices – prices that were above fair value even at that time. Are borrowing costs meaningfully lower in May of 2017 than in May of 2014? Not really. The 10-year was at 2.6% then versus 2.4% today.
There are those who point out that companies have spent the better part of these last three years buying back shares of their own stock. The decision to do so reduced the supply available to the rest of the investment community, artificially creating demand for shares that have become scarce.
Nevertheless, corporations appear to be scaling back on the repurchase activity. Data put forward by Goldman Sachs (NYSE:GS) show that executed buybacks have dropped 20% in 2017 compared to the same period a year earlier. Meanwhile, companies are authorizing new programs at the slowest pace in five years.
If Goldman Sachs data show that, across a wide range of metrics, that the median stock in the S&P 500 currently trades in the 98th, 99th or 100th percentile of historical valuation, is it possible that buybacks have lost their luster due to ridiculously expensive shares? (Not that this is currently dissuading the rest of participants from loading up on “FAANG.”) Indeed, investing complacency has gotten to a point where the fear of financial loss has practically disappeared.
Consider the following evidence: Typically, one-fifth of trading sessions witness 1% moves in the major benchmarks like the S&P 500. So far in 2017? Three days. All in the month of March. With 90 days gone, we’ve only seen 1% moves in roughly three-one hundredths of trading days as opposed to one-fifth of trading days.
The most common method for examining volatility (or lack thereof ) occurs via the CBOE S&P 500 Volatility Index (VIX). What does it represent? The market’s expectation of stock market price swings over the next 30-day period. And with intra-day VIX readings breaking below 10 daily, where few seem to think the S&P 500 would move within a 10% annual range, you have to travel back to January and February of 2007 to find this level of complacency.
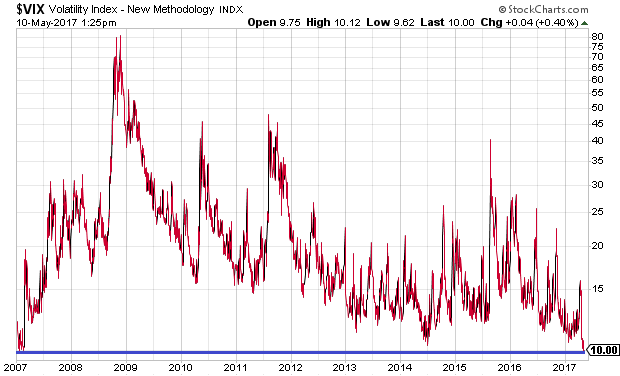
It should be noted that the VIX does not predict future stock performance. That said, ultra-low volatility levels do seem to take place when stock valuations are high and investors are not fearful, as evidenced by early 2007. It follows that if you prefer to be greedy when others are fearful, and fearful when others are not, perhaps this is not the best time to acquire additional risk assets.
One last tidbit on the absence of fear? Data from the Yale University Stock Market Confidence Indices recently demonstrated (March) that only 1% of institutional investors expect the US stock market to be down year-over-year. That is the mot bullish sentiment on the monthly survey going back to its 1989 origins. Investor bullishness (and bearishness) is a contrarian indicator.
Keep in mind, four-fifths of the U.S. stock market gain since the 2009 low came by the end of 2014. The bulk of my moderate growth-and-income clients fully participated at their target allocation of 65%-70% widely diversified equity (30%-35% widely diversified income). My tactical asset allocation decision to downshift to 50% high quality stock, 25% investment grade income and 25% cash/cash equivalents in mid-December of 2014 – a move that corresponded to the settlement of the Federal Reserve’s final “QE3” asset purchase – has been described by a number of people as too bearish. We will continue agreeing to disagree.
Sure, the “FAANG” market may still have some teeth. The companies may continue to take the market to new heights. Still, sensible risk management (at least according to Benjamin Graham) is not about the maximizing of near-term return; rather, it is about increasing one’s likelihood of successfully achieving advantageous long-term results with less risk of severe financial loss. It follows that I can tolerate the possibility of missing a portion of immediate upside to maintain a capacity to acquire great companies, including the “Amazons” of the world, at lower valuations and greater forthcoming returns.
