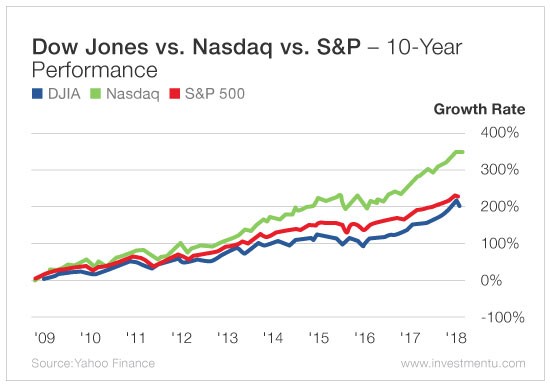
If the bull run that began in March 2009 is still alive and kicking, it will officially become the longest in history.
As you can see in the chart below, since rising from the rubble of the financial crisis, the Dow Jones Industrial Average (DJIA), the S&P 500 and the NASDAQ have been on profitable runs, each gaining more than 200%.
And the markets were really goosed in 2017. The Dow posted 71 closing records in the year - the most ever.
In October 2016, I told investors to expect the bull to continue charging higher.
I wrote that the S&P would likely gain at least 19.4% in 2017 - which it did.
That's part of the cycle we see in the markets.
But now there's some reason for caution...
Too Much of a Good Thing
Complacency has crept in as investors have enjoyed what is quickly becoming the longest bull run ever.
We even saw a double-digit surge across the board in stocks from November 2017 to January 2018.
But over the last couple of weeks, investors have been battered by terrifying swoons.
Last week, two sessions ended in 1,000-point declines... and another swung wildly within a 1,000-point range.
On the Nasdaq, nine out of every 10 stocks fell.
And on February 5, the Volatility Index (VIX) shot up 282% for the year, hitting its highest level since August 2015.
It was one of the worst weeks for the markets since the financial crisis.
The Dow has tumbled more than 12% from its all-time high set on January 26. All three major indexes are negative for the year. And the 10% correction everyone was waiting for finally came.
But this recent sell-off was different, in part because of its unusual swiftness.
The S&P lost 10% of its value in only 13 days.
These Simple Technical Analysis Tools Are Vital to Your Investing Success
Technical analysis is the study of price and volume activity in the stock market, and there are three powerful tools that will help you find buying opportunities in the market.
Any investor can become a technical analysis pro by using these simple buy and sell indicators.
We’ve also done the research for you and found five stocks hitting these urgent buy signals right now.
Now, people will say, "In 1987, the market lost much more than that in a single day."
That's true. But that doesn't mean 13 days is healthy.
Historically, it's taken the S&P an average of 64 days to lose 10% of its value.
For example, in 2015, the last double-digit correction of the S&P took 100 days.
Something different is underway.
We can all agree the market was a little frothy. But a haircut that quick and that fast on the possibility of rising inflation? A new Fed chair? The rise of the machines?
And yet, the economic backdrop is positive.
So what happens when data becomes something to worry about?
That's why I believe this was likely only the first correction of 2018.
With Every Cloud, There's a Silver Lining
Over the last couple of weeks, we've all woken up to a head-scratcher of a premarket.
The indexes are either up or down an eye-popping amount. There is no middle ground. And likely, halfway through the day's session, an about-face will occur. The early morning worry dissolves into euphoria or vice versa.
On top of that, the CAPE ratio - short for cyclically adjusted price-to-earnings ratio - is at its highest level since 2001. And the market-to-GDP ratio, or the Buffett Indicator, is currently at 139.3%, the highest since 2000.
Both are essentially suggesting an overpriced stock market, which can be disconcerting to the average investor.
But it doesn't have to be.
I'm an avid believer in the idea that there's a bull market somewhere... regardless of whether we're in a bull or bear environment.
I came of age as an investor during the dot-com crash and the financial crisis.
Volatility and collapses are my specialty.
You don't go to cash in a market like this. This is the time investors must add to their toolboxes.
Because, realistically, most investors focus only on various forms of momentum strategies. (No doubt about it, these do great in bullish periods.)
But, if you haven't already, it's time to look at investment strategies that take advantage of corrections and pullbacks... and even the dreaded possibility of the current bull dying.
Don't worry though. Some of the biggest moneymaking opportunities I've ever seen have come right in the middle of a correction. That's why I believe this should be on every investor's radar during the year ahead.
Remember: There's always a bull market somewhere... even when the market is falling.
Good investing,

