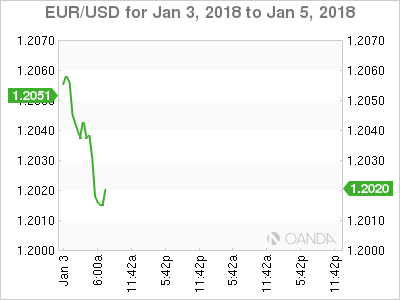
Today’s release of the December FOMC minutes (2pm ETD) may have the potential to curtail the ‘mighty’ U.S dollar’s longest losing streak in nearly four-years.
Market bulls are hoping that the minutes’ commentary could play down the prospect of a March rate-hike pause – it would be the first meeting to be led by Chairman-designate Powell.
Note: The fixed income market is currently pricing in a +68% chance of a Fed March hike and two more hikes for 2018.
On the on the other hand, dollar ‘bears’ continue to expect the currency to underperform against its G10 partners, pressured by the Fed taking a more cautious approach this year, while other central banks will likely appear more willing to tighten their own monetary policies (ECB and BoE).
Note: U.S dollar bulls were the biggest losers in 2017 as the dollar index fell just shy of -10 % against a plethora of G10 currency pairs with the EUR being the big winner, climbing +14% outright as the European economy performed much better than expected.
U.S construction spending and ISM manufacturing data are due at 10 am EDT.
1. Global stocks advance
Equity gauges have allied across Asia and Europe in the overnight session, although Japanese markets remained closed. Emerging-market shares also gained for a second consecutive session.
Down-under, resource stocks once again supported Australia’s stock market, allowing it to rise slightly and reverse yesterday’s small drop. The S&P/ASX 200 rose +0.2%. In S. Korea, the KOSPI rallied +0.3%, notching a fourth-straight gain.
In Hong Kong, shares rose for the seventh straight session to a fresh decade-high, aided by strength in index heavyweight Tencent and consumer goods stocks. At close of trade, the Hang Seng index was up +0.15%, while the Hang Seng China Enterprise (CEI) index rose +0.17%.
In China, equities rose for a fourth straight session overnight, aided by strong gains in consumer and transport firms. The Shanghai Composite index was up +0.65%, while the blue-chip CSI300 index was up +0.61%.
In Europe, regional indices trade higher across the board following on from the momentum seen Asia and stateside yesterday. Both the DAX and CAC lead the gainers recovering from declines seen yesterday, aided by a slight pullback in the EUR (€1.2041).
U.S stocks are set to open in the black (+0.2%).
Indices: Stoxx600 +0.3% at 389.4, FTSE flat at 7648, DAX +0.4% at 12920, CAC 40 +0.2% at 5299, IBEX 35 +0.2% at 10097, FTSE MIB -0.1% at 21812, SMI +0.4% at 9417, S&P 500 Futures +0.2%
2. Oil prices dip as higher output looms, gold softer
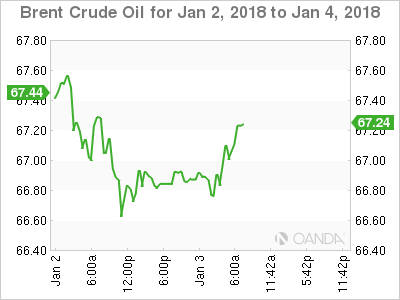
Oil prices trade a tad weaker, just shy of their mid-2015 highs reached Tuesday as high output in the U.S and Russia balanced tensions from a sixth day of unrest in OPEC member Iran.
Brent crude futures are at +$66.74 a barrel, up +17c but still trailing yesterday’s high of +$67.29. U.S West Texas Intermediate (WTI) crude futures are at +$60.50 a barrel, up +13c cents from the close, though still not far off the $60.74 reached on the previous day that was the highest since June 2015.
Despite anti-government protesters continuing to demonstrate in Iran – a major oil exporter – market sentiment remains bullish on the back of falling inventories globally and strong economic growth forecasted.
Note: Oil markets have been supported by a year of production cuts led by OPEC and Russia. The cuts started 12-months ago and are scheduled to cover all of 2018. While in the U.S, commercial crude oil inventories have fallen by almost -20% from their historic highs last March, to +431.9m barrels.
Strong global demand growth, especially from China, has also been supporting crude.
A concern for the crude bull should be rising U.S production, which is on the verge of breaking through +10m bpd.
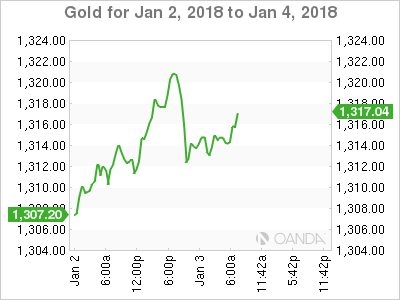
Gold prices have edged down ahead of the U.S open after hitting their four- month high, as the U.S dollar recovers from its overnight lows. Also providing pressure are some technical indicators that point to a short-term correction. Spot gold has fallen -0.4% to +$1,312.35 an ounce.
Note: The ‘yellow’ metal earlier hit +$1,321.33.
3. U.S yields back up
U.S Treasury prices have weakened in the past 24-hours as a wave of short-term Treasury bill supply is met with declines in prices for German Bunds and U.K Gilts.
Tuesday, U.S 10-year product backed up +6 bps to +2.465%, its biggest one-day jump in nearly a month. Investors will look to today’s FOMC December minutes for guidance.
Note: The Fed is expected to offer more details on policy makers’ outlook for 2018.In December, officials voted to raise their benchmark federal-funds rate by +25 bps to a range between +1.25% and +1.5%, and penciled in three quarter-point rate increases for 2018.
In Europe, yields have been rallying amid concerns that the strong EUR (€1.2041) may slow the European Central Bank (ECB) from winding down easy money policies, which could lead to a pickup in inflation.
Also providing pressure to sovereign yields is supply – this week, some corporate bonds and sovereign issuers (Ireland and Belgium come to the market) are in play and fixed income dealers have been making room to take down ‘new’ product by selling some benchmarks.
In Germany, the 10-year Bund yield has decreased -1 bps to +0.46%, while in the U.K, the 10-year Gilt yield has dipped -2 bps to +1.267%.
4. U.S dollar makes a small recovery
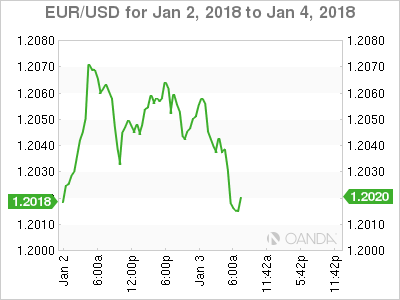
The USD is trying to recover some of its recent losses against the major pairs.
The EUR/USD (€1.2038) continues to trade in a tight holiday range, unable to penetrate the psychological €1.21 handle despite the ECB’s Nowotny suggesting that the central bank “may end its QE operations in 2018 should the economy stay strong.”
Note: The EUR bull continues to preach that the single unit has the potential to test the pivotal €1.24 area in H1.
In Scandinavia, both the SEK (€9.8300) and NOK (€9.7532) currencies are trading a tad firmer outright as Nordic central banks may now be in a position to bring forward their own tightening approach.
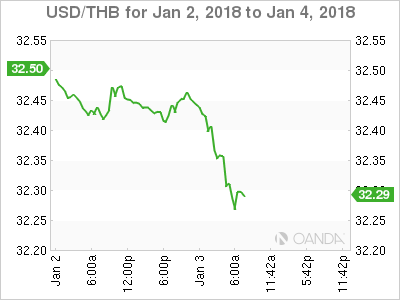
Elsewhere, Asian currencies continue to exhibit some strength into this New Year. THB (+0.48% to $32.24) has hit its strongest level since April 2015; PBoC set yuan (¥6.4920) at strongest level since May 2016.
5. U.K December construction PMI falls
U.K data this morning showed that the Purchasing Managers’ Index (PMI) for construction fell to 52.2 in December, from 53.1 in November.
Digging deeper, the details of the survey showed new orders rising to a seven-month high and job creation the strongest since June.
The pounds reaction (£1.3562) is somewhat muted as investors remain relatively upbeat about the prospects for an improving U.K economy.
Note: The BoE is expected to keep its benchmark interest rate steady in Q1. The outlook for policy for the rest of 2018 will depend heavily on progress in the U.K’s negotiations to withdraw from the E.U. The BoE raised its benchmark rate for the first time in a decade in November to +0.5% to keep a lid on accelerating inflation. The pickup in price growth last year was mostly fuelled by a weak pound.
