👀 Copy Legendary Investors' Portfolios in One ClickCopy For Free

World Money Flow: 3 Financial ETFs Vs World Indices Tell The Tale

Published 11/30/2017, 06:35 AM
Updated 07/09/2023, 06:31 AM
US500
-
STOXX50
-
GXC
-
XLF
-
SSEC
-
EUFN
-

It appears that several international Financial ETFs have, generally, performed well over the past couple of years and are either approaching major resistance, or have already reached it, when compared with their respective country's Major Index on a ratio basis.

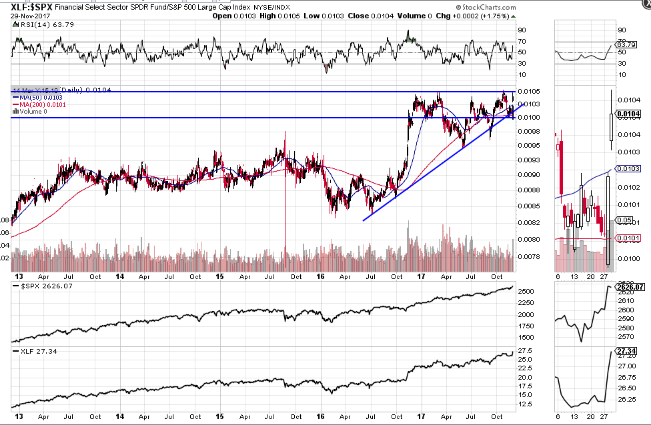
The first is the Financial Select Sector SPDR Fund vs the S&P 500, XLF:SPX ratio, as shown on the 5-Year Daily ratio chart below.

XLF:SPX Daily 2013-2017

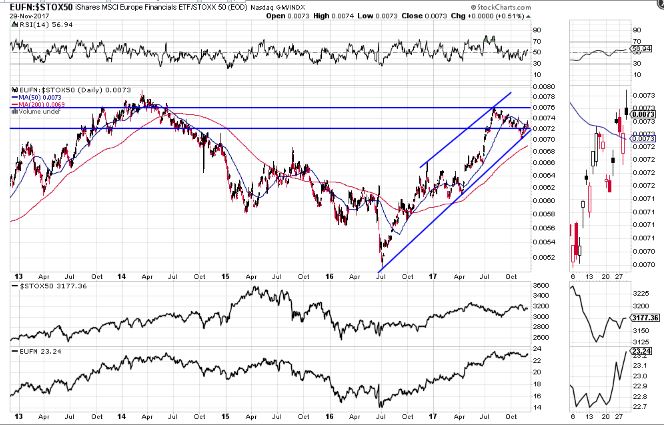
The second is the iShares MSCI Europe Financials ETF vs the EuroStoxx 50 Index, EUFN:STOX50 ratio, as shown on the 5-Year Daily ratio chart below.

EUFN:STOX50 Daily 2013-2017

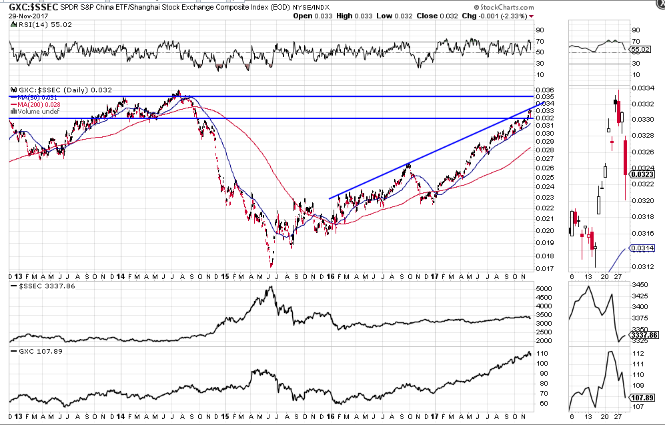
The last is the SPDR S&P China ETF vs the Shanghai Composite, GXC:SSEC ratio, as shown on the 5-Year Daily ratio chart below.

GXC:SSEC Daily 2013-2017

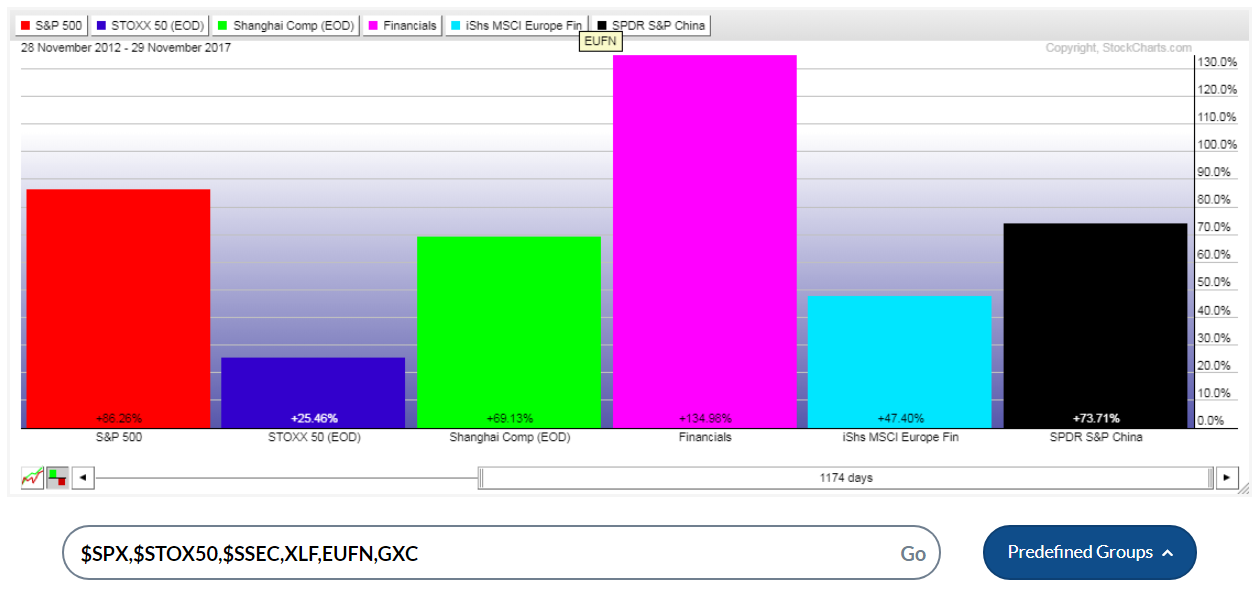
The following graph shows the percentages gained by the 3 Major Indices and 3 ETFs during the past 5 years.

Performance: 3 Major Indices vs Financial ETFs 2012-2017

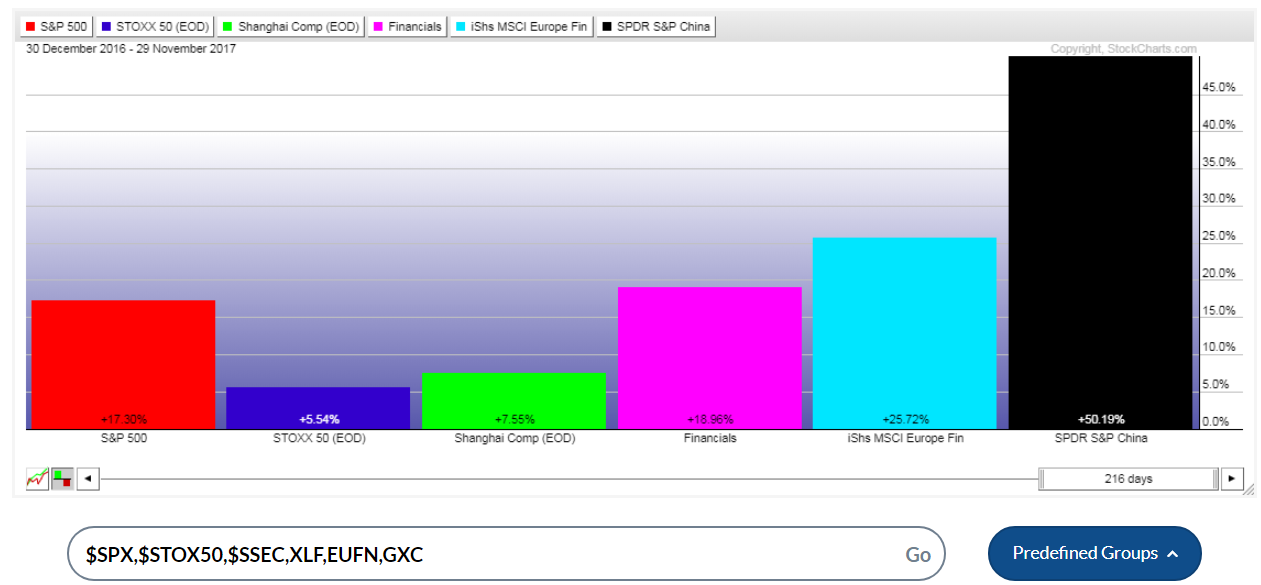
The next graph shows the percentages gained by the 3 Major Indices and 3 ETFs year-to-date.

% Gains, Indices vs ETFs YTD

It's evident that, during the 5-year period, the XLF has outperformed European and Chinese Financial ETFs, on a percentage-gained basis. The SPX has not only outperformed the other 2 Major Indices, but also their 2 ETFs.

On a year-to-date percentage basis, China's ETF has far outpaced the other 2 ETFs. The SPX has outperformed the other 2 Major Indices, but has lagged behind all 3 ETFs, especially China's ETF.

From this comparison, you can see that world money flow, while slowing in the U.S. Financial ETF this year, has accelerated, relatively-speaking, in the European and (especially) Chinese Financial ETFs.

Inasmuch as price levels on all three ratios are at or near major resistance, we'll see which market traders favor going forward into year end and 2018. These charts are worth monitoring to gauge the strength or weakness of these countries' financials.

We may see a rotation of funds out of China's financial markets (and, possibly, out of Europe if full transparency is made available as to their banks' true vulnerability regarding accurate stress tests of capital requirements) and into the U.S., for example, as traders anticipate several interest rate hikes by the Fed (one this December and 2 or 3 next year).

Latest comments

Loading next article…
Risk Disclosure: Trading in financial instruments and/or cryptocurrencies involves high risks including the risk of losing some, or all, of your investment amount, and may not be suitable for all investors. Prices of cryptocurrencies are extremely volatile and may be affected by external factors such as financial, regulatory or political events. Trading on margin increases the financial risks.
Before deciding to trade in financial instrument or cryptocurrencies you should be fully informed of the risks and costs associated with trading the financial markets, carefully consider your investment objectives, level of experience, and risk appetite, and seek professional advice where needed.
Fusion Media would like to remind you that the data contained in this website is not necessarily real-time nor accurate. The data and prices on the website are not necessarily provided by any market or exchange, but may be provided by market makers, and so prices may not be accurate and may differ from the actual price at any given market, meaning prices are indicative and not appropriate for trading purposes. Fusion Media and any provider of the data contained in this website will not accept liability for any loss or damage as a result of your trading, or your reliance on the information contained within this website.
It is prohibited to use, store, reproduce, display, modify, transmit or distribute the data contained in this website without the explicit prior written permission of Fusion Media and/or the data provider. All intellectual property rights are reserved by the providers and/or the exchange providing the data contained in this website.
Fusion Media may be compensated by the advertisers that appear on the website, based on your interaction with the advertisements or advertisers.
© 2007-2024 - Fusion Media Limited. All Rights Reserved.