Risk has come back into markets, and the bulls have wrestled back control. Most have blamed last week’s volatility spike on the systematic funds liquidating positions, as the short volatility trade unwound rapidly. The view is that now much of this positioning has been shaken out and in the last few sessions, we’ve also seen a stable USD, the US 10-year Treasury has traded a tight range of 3.17% to 3.14%, and high yield credit spreads have tightened relative to the risk-free rate. This, in turn, has allowed traders to re-focus away from the macro towards micro, and, predictably, a solid US corporate earnings.
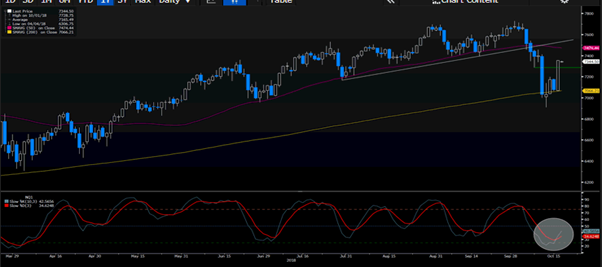
The NASDAQ 100 has had the big move here, with the buyers having defended the 200-day MA last week, with NASDAQ futures gaining an additional 0.9% on the strong Netflix (NASDAQ:NFLX) result, with the stock closing up 11% in the after-hours trade. Momentum has shifted, and we can see the crossover in stochastic momentum, and there seems scope for a push in this index into the 50-day MA at 7460, which contained the sell-off through June into October. Perhaps, if the bulls bid this index up, we can see the former July uptrend come in as resistance at 7560. I would be placing stops below 7158 (the 30 July low).
The S&P 500 also looks far more bullish here, having pushed above last Wednesdays high and again we have seen a shift in the momentum oscillators. I see scope for a move into 2864, but this is premised on further limited moves again in rates, US Treasury’s and the USD and whether implied volatility (a la ‘VIX’ index) continues its move into 15% and below. A big ‘if’, of course, especially when we have a likely ratings downgrade to Italian sovereign rating coming at any stage, and the FOMC minutes due tonight, with the having a deep dive into a number of key macro issues.
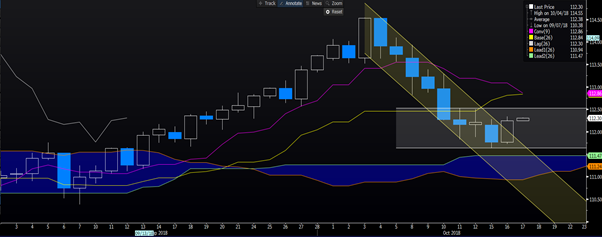
Indeed, we can see the relief playing through in Asia, with solid moves in the Nikkei 225 (+1.5%), helped by a move higher in USD/JPY. As a Segway, USDJPY may have had a bullish break of the October downtrend, but I am keen to see a bit more momentum kicking into the upside here, and the preference is to see a move through 112.53 (the consolidation range high) before holding greater conviction to hold longs. The 38.2% retracement of the recent sell-off (from 114.55) at 112.75 could be another level we find supply to kick in. The weekly chart still needs a lot of work to attract further buyers.
China found good buyers too on open, but if you look at price action on an intra-day chart, for the third day in a row traders have faded the rally and this often tells a story on semantics. China’s property index is always on the radar and while this has pushed up 1% today, if we look at the daily chart here the set-up looks awful, and rallies are to be sold. The ASX 200 has pushed through last Thursday's highs, and the index sits at the highs of the day, with financials putting in 26-points. One consideration is that the Aussie SPI futures are testing and held up at the 38.2% retracement of the September sell-off at 5920, so if the bears need levels, then this is one that could get some attention. A move through here though would be clear bullish move, and naturally, this will drive the ASX 200.
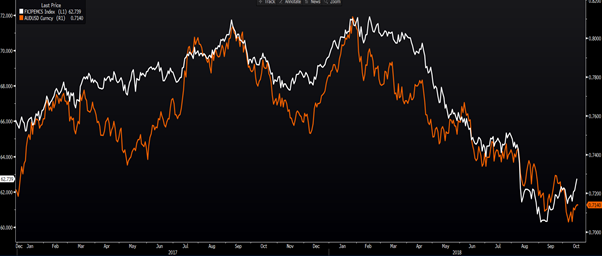
Again, as a segway an insightful chart, which was posted by Robbie Rennie (of Westpac Research - on Twitter), is the correlation between AUD/USD (orange line) and the JP Morgan emerging market (EM) index. The notion that the AUD is the G10 proxy of EM is clear here, and while there are periods where one index will pull away from the other, consider the year-to-date correlation coefficient (by value) is 0.90 - which is just incredibly high. So, we know 90% of the variability of the AUD/USD can be explained by the EM index. With the EM index leading perhaps we can argue that AUD/USD can push higher here. This is not a trade idea, more an interesting correlation that could be telling.
When will we see a bear market in stocks – what to look out for?
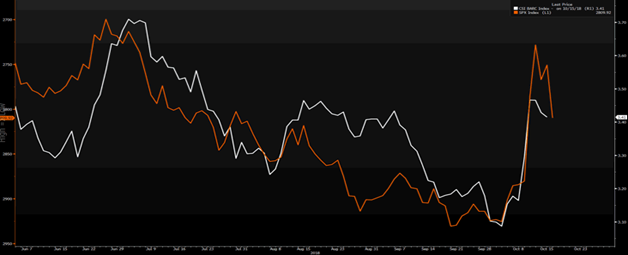
Like many, I am keeping a beady eye on credit spreads, with high yield credit spreads having a touch of underperformance relative to risk-free rates. Historically speaking, credit leads equity and we can see the correlation between high yield spreads (white line) and the S&P 500 (orange- inverted) currently in play.
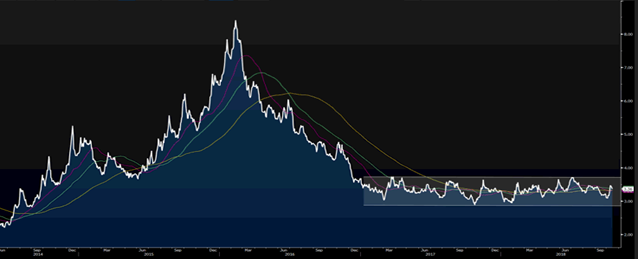
The answer to this question is probably not anytime soon according to two charts I look at. Firstly, if we focus on high yield credit (over US Treasury’s) and we can see a very interesting chart. A break in either direction of this range will be telling and if we truly expect to see a 10-15% drawdown in the S&P 500 then I want to see this breaking above the top horizontal level of 3.76% - the spread currently sits at 3.36%.
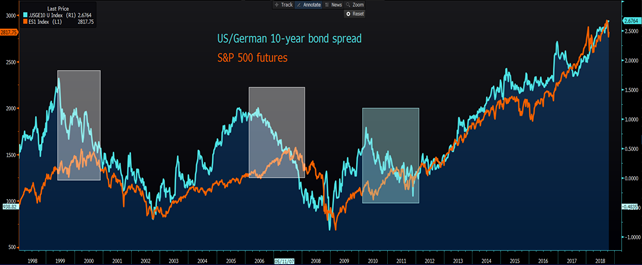
I also want to see the US Treasury premium over German bunds come in fairly significantly, as this has traditionally been a solid forward-looking indicator for a drawdown in the S&P 500. That is not occurring right now.
Brexit trade
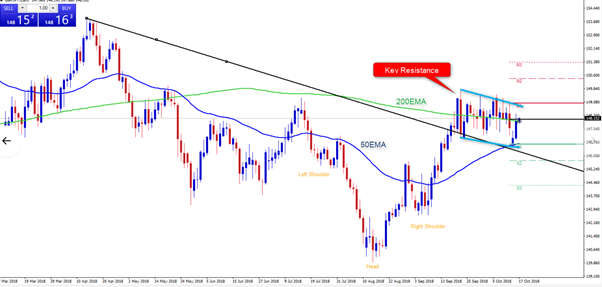
One last chart I am looking at is that of GBP/JPY. My colleague Aron Marton put this chart in front of me this morning, and he likes the set-up too. My prior view was to take a position only when the pair had a daily close through the range, and that hasn’t occurred yet. However, we feel the balance of risk is for higher levels. We can see price having broken and held the retest of the April downtrend, but it’s the inverse head and shoulders and bull flag that has us interested here. Fundamentally, the prospect of no deal being achieved in the Brexit talks seems to be growing by the day, but the market is looking through the noise, and it feels as though it is just a matter of time before the bull flag completes.
With the EU Summit starting tonight and expectations having been lowered of late, it feels the downside is cushioned to an extent, but the market would be surprised if something did come out left of centre. Let’s see, and my preference is still to trade when price closes to complete the pattern. When it does complete, I would keep position sizing to a minimum because the prospect of a GBP vol event is growing by the day.
