The starter's gun was fired. The runners are moving. The race is on! The same in the equity markets. And so far many of the participants has already exceeded their personal bests. The Nasdaq 100 was the first to break higher and leading the pack. In May the Russell 2000 joined in, making a new all-time high. And in August the S&P 500 crossed to new highs. And just this week the Transports broke to new highs.
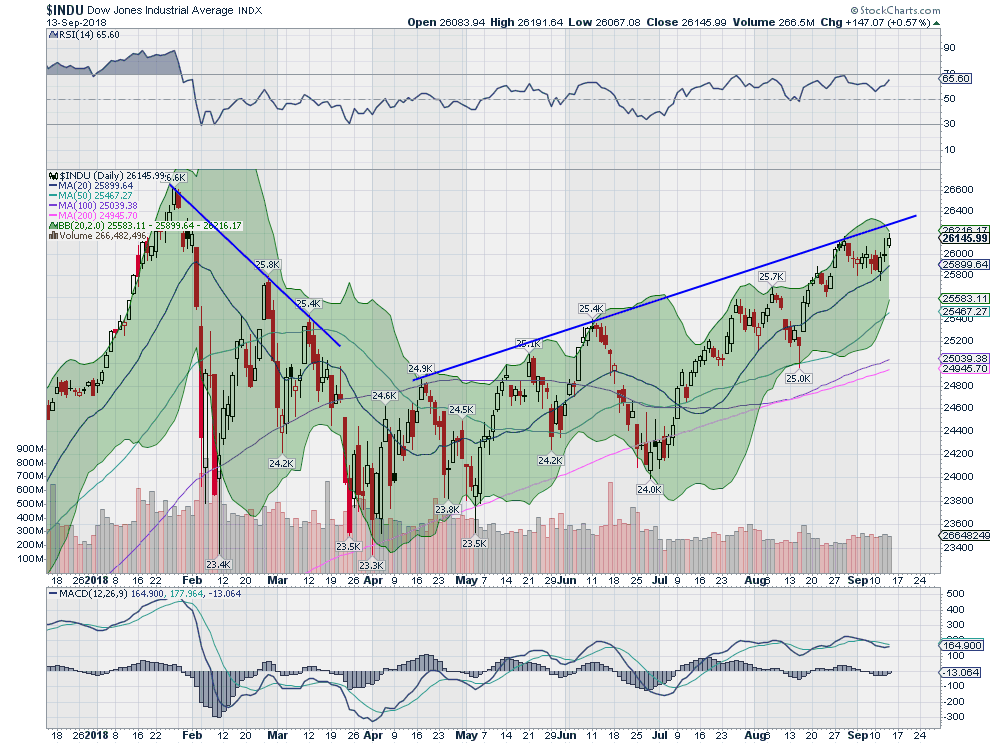
But the Industrials remain below their January peak. They are not much below, less than 2% away, but they continue to lag the broader market. Will they catch up? Or at least make a new all-time high? There are a few things in to watch for in the chart below to help answer those questions.

First notice that the Industrials have been trending higher since April. That is a good sign. Trend line resistance has developed and the Index is close to that line now though. A possible place for a pause, but rising or falling trend lines are more sentiment based and not where actual price battles have occurred, so the Index may just ignore it.
The Bollinger Bands® are squeezing in. This is often a precursor to a move in price. The momentum indicators are both in bullish ranges. The RSI is also moving higher with the MACD positive and about to cross up again. These would combine to suggest a pretty good chance of a move to the upside. Time will tell whether this laggard has the energy left in the tank to catch up to the pack.
The information in this blog post represents my own opinions and does not contain a recommendation for any particular security or investment. I or my affiliates may hold positions or other interests in securities mentioned in the Blog, please see my Disclaimer page for my full disclaimer.
