📈 69% of S&P 500 stocks beating the index - a historic record! Pick the best ones with AI.See top stocks

Index Technicals

Published 02/22/2019, 12:04 AM
Updated 07/09/2023, 06:31 AM
US500
-
DE40
-
IXIC
-

DAX

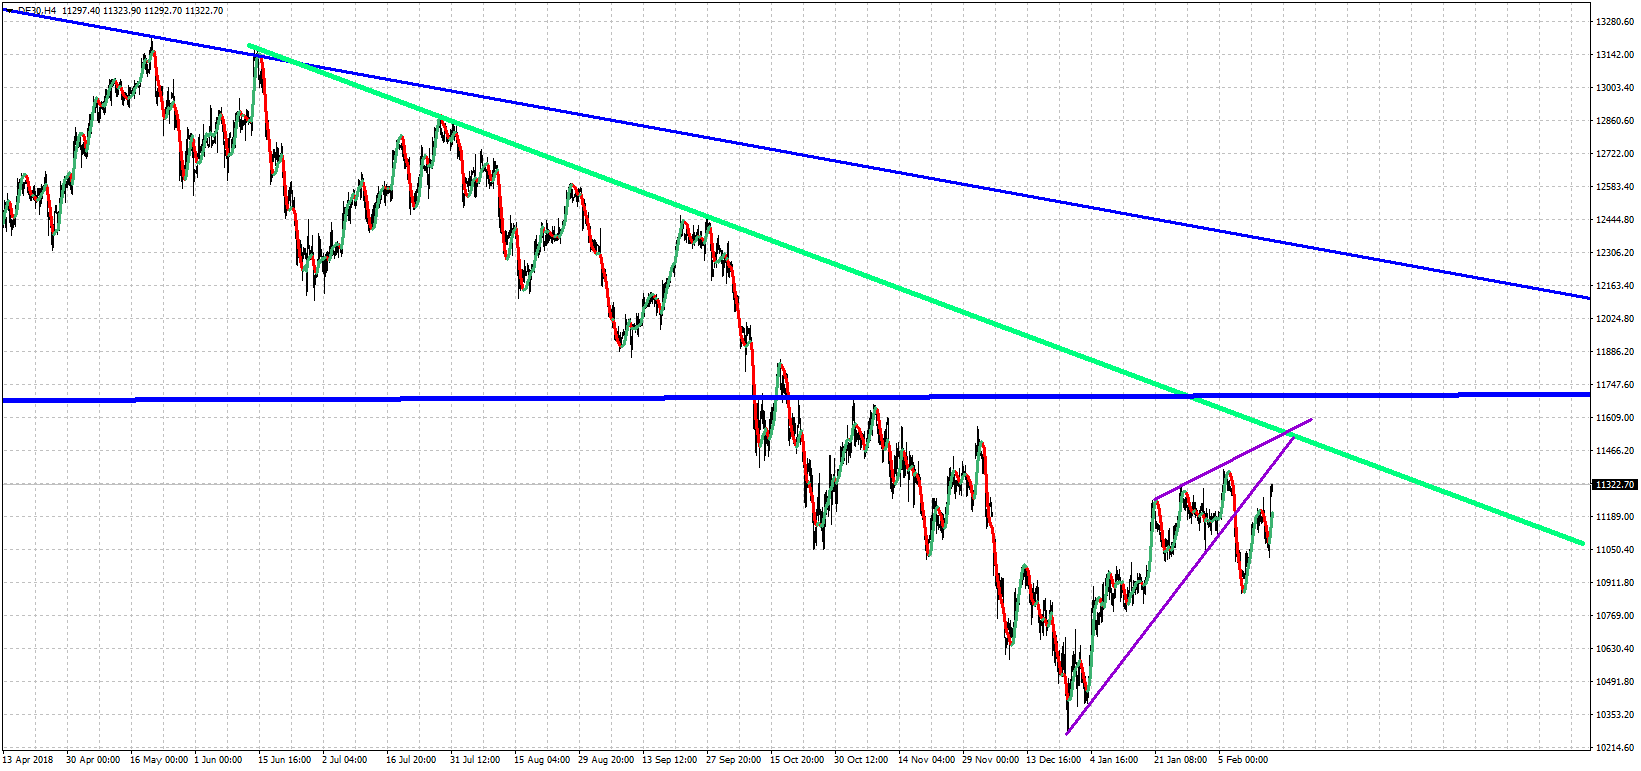
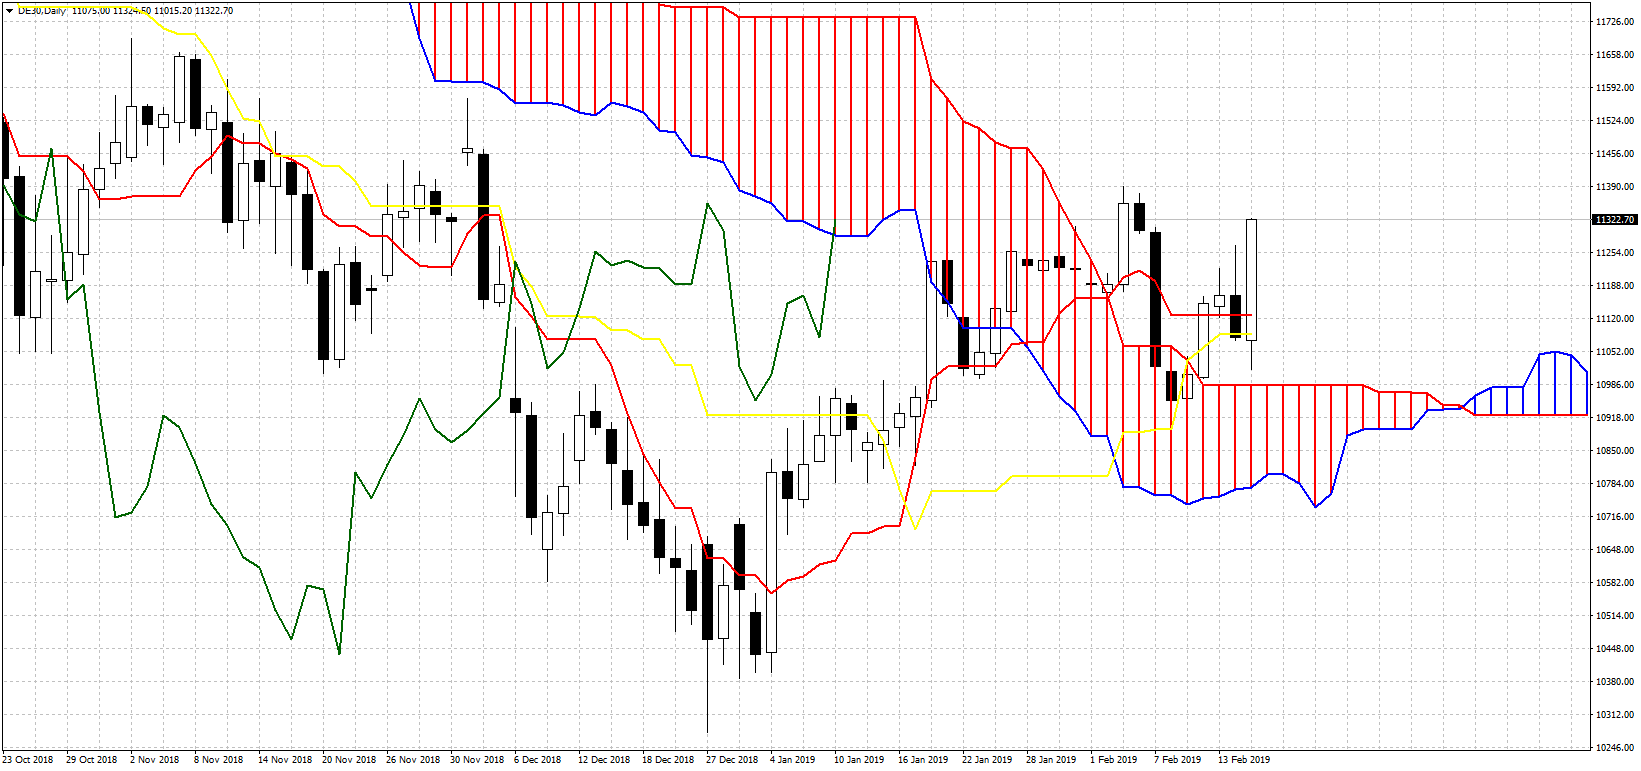
11400-11420 short-term target for a top, back test of broken Trend line and also challenge of long-term downward sloping trend line since June 2018 highs.
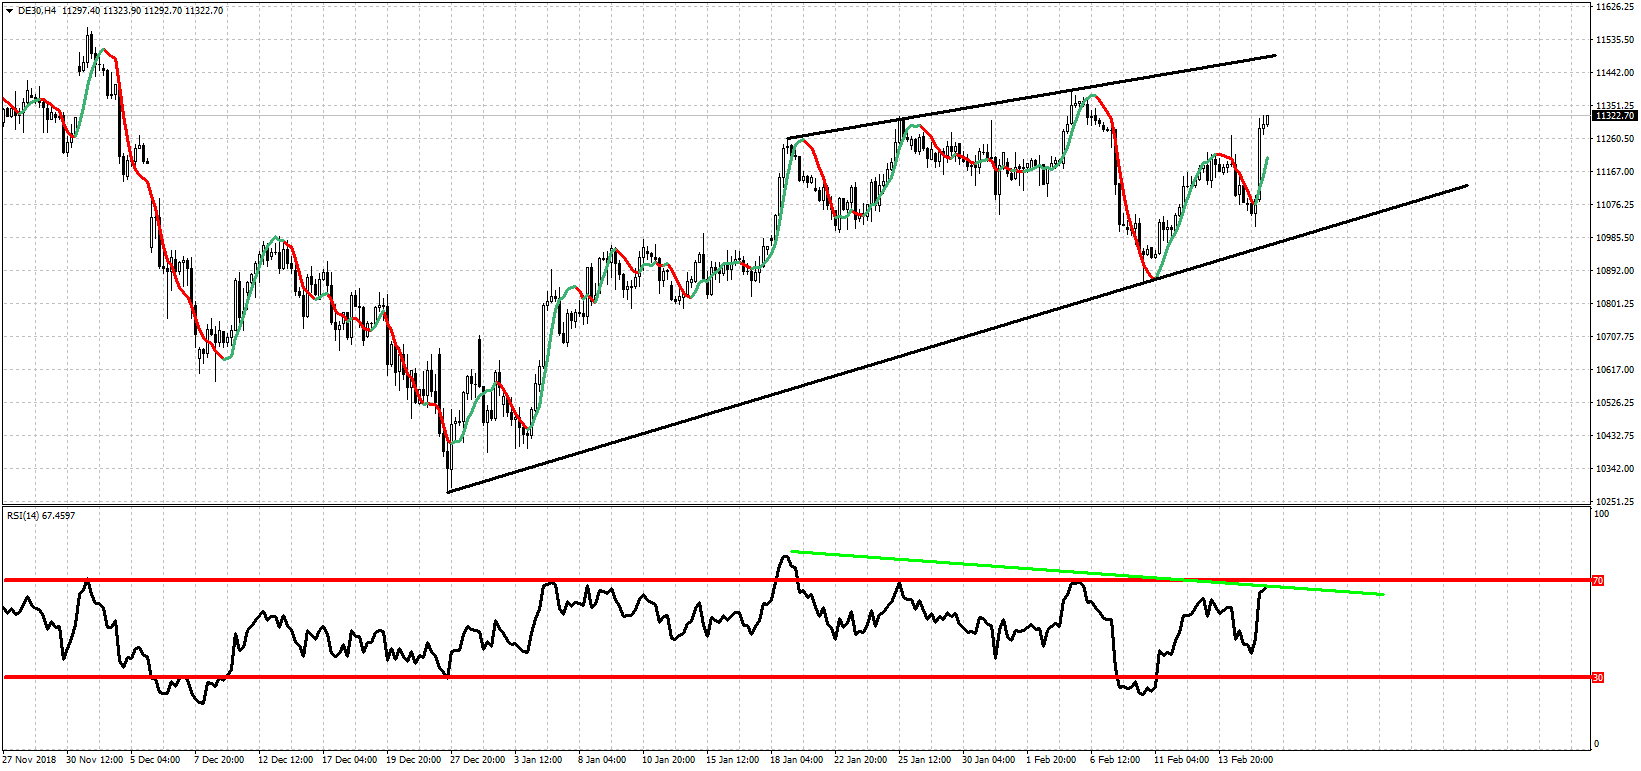
DE30 4 Hour Chart DE30 4 Hour Chart

Signs of RSI bearish divergence. Key support at 10980. Coincides with upper Kumo (cloud) boundary.
DE30 Daily Chart

SPX

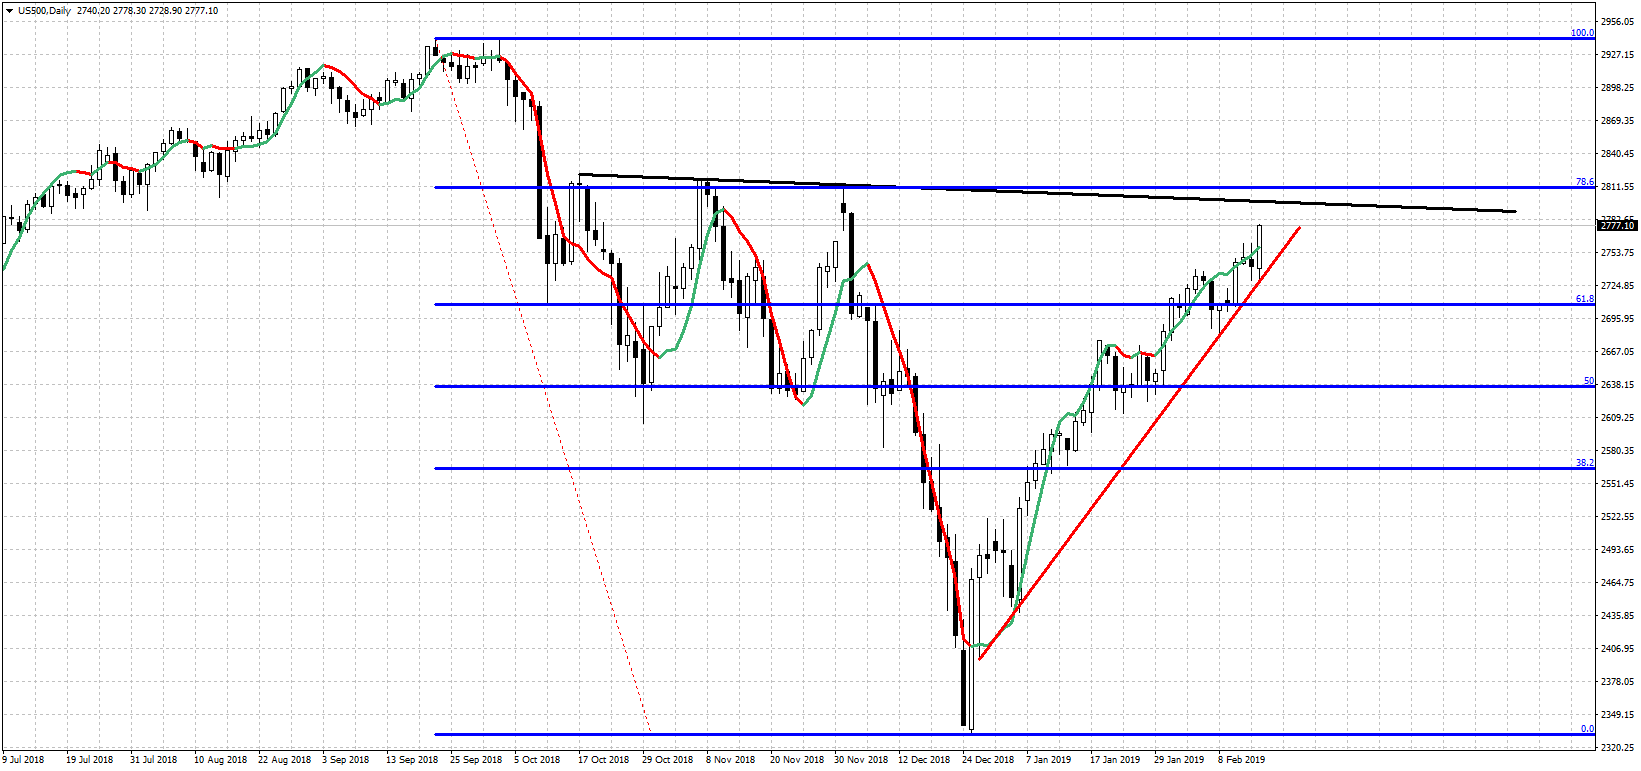
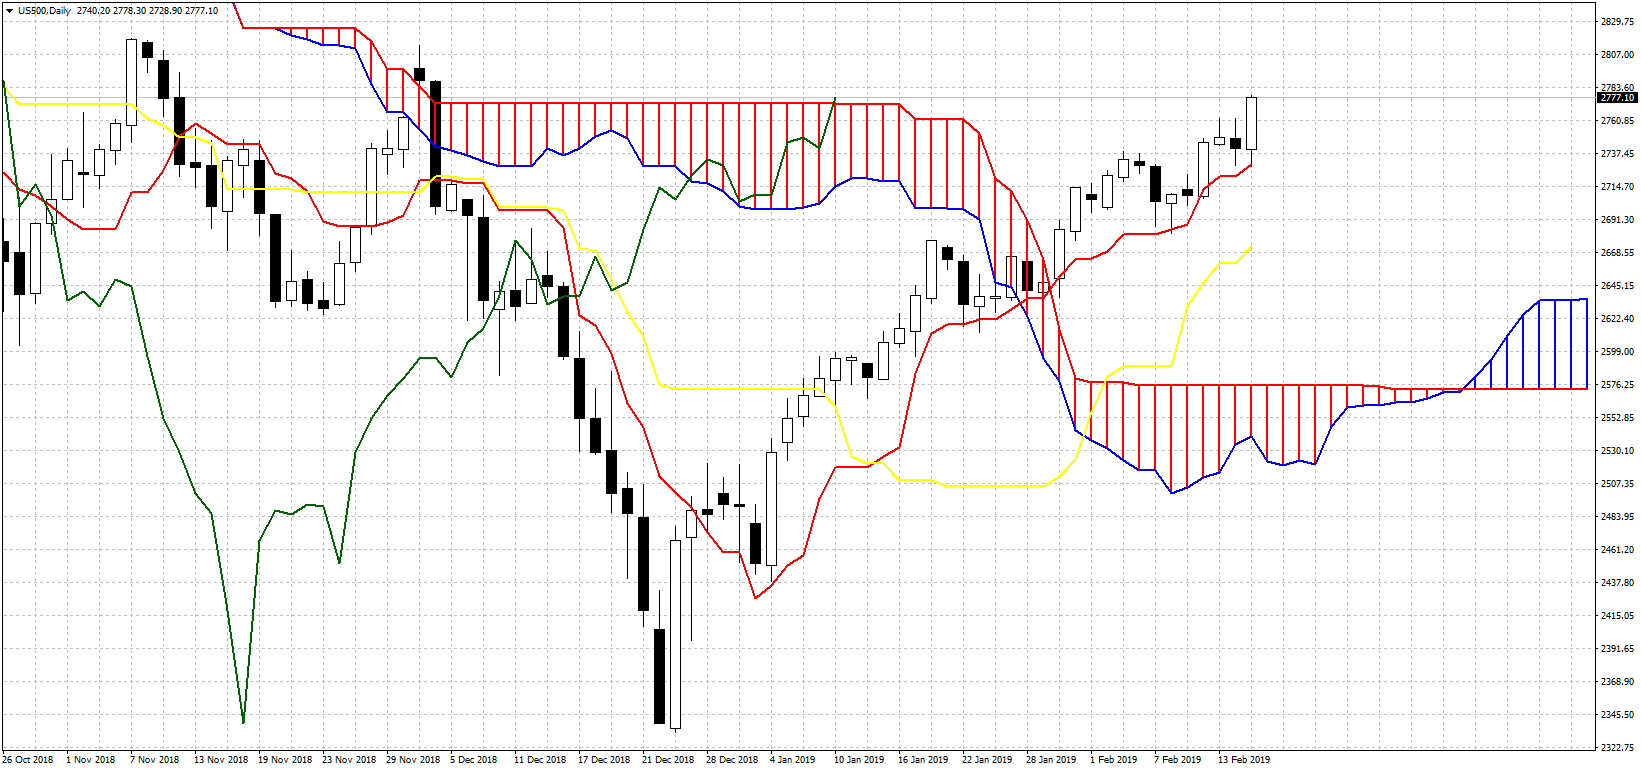
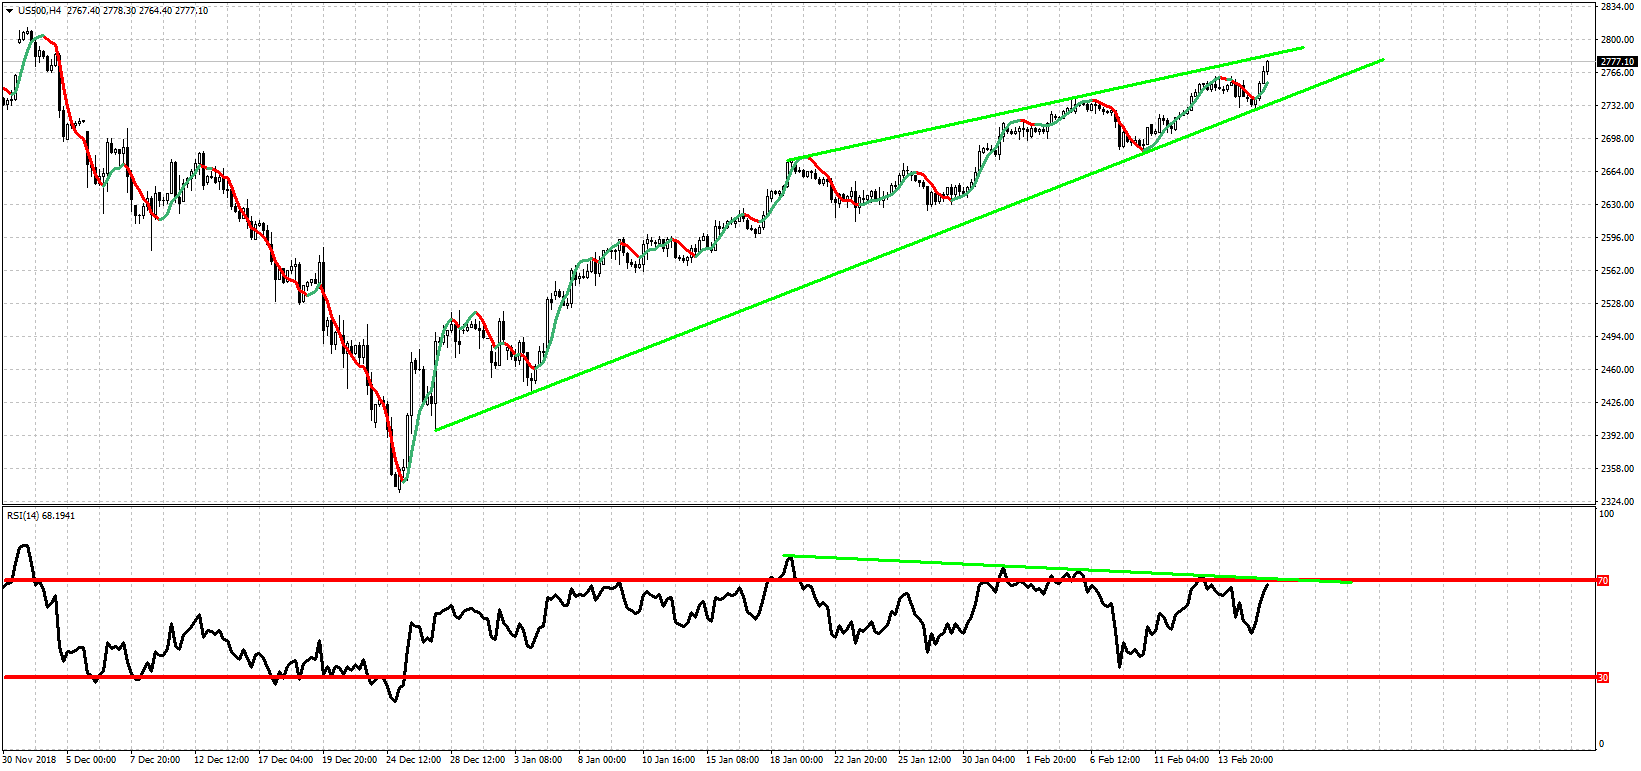
Continues to rally making higher highs and higher lows. Will the bearish RSI signs be confirmed? will we see a pull back and a back test at cloud support around 2600-2570?
US500 Daily Chart US500 4 Hour Chart US500 Daily Chart

Next important resistance is at 2810-2800 and support at 2730. Loss of 2730 implies pull back has started. I do not see much more upside potential at this time. I’m positioned for a pull back.

NASDAQ

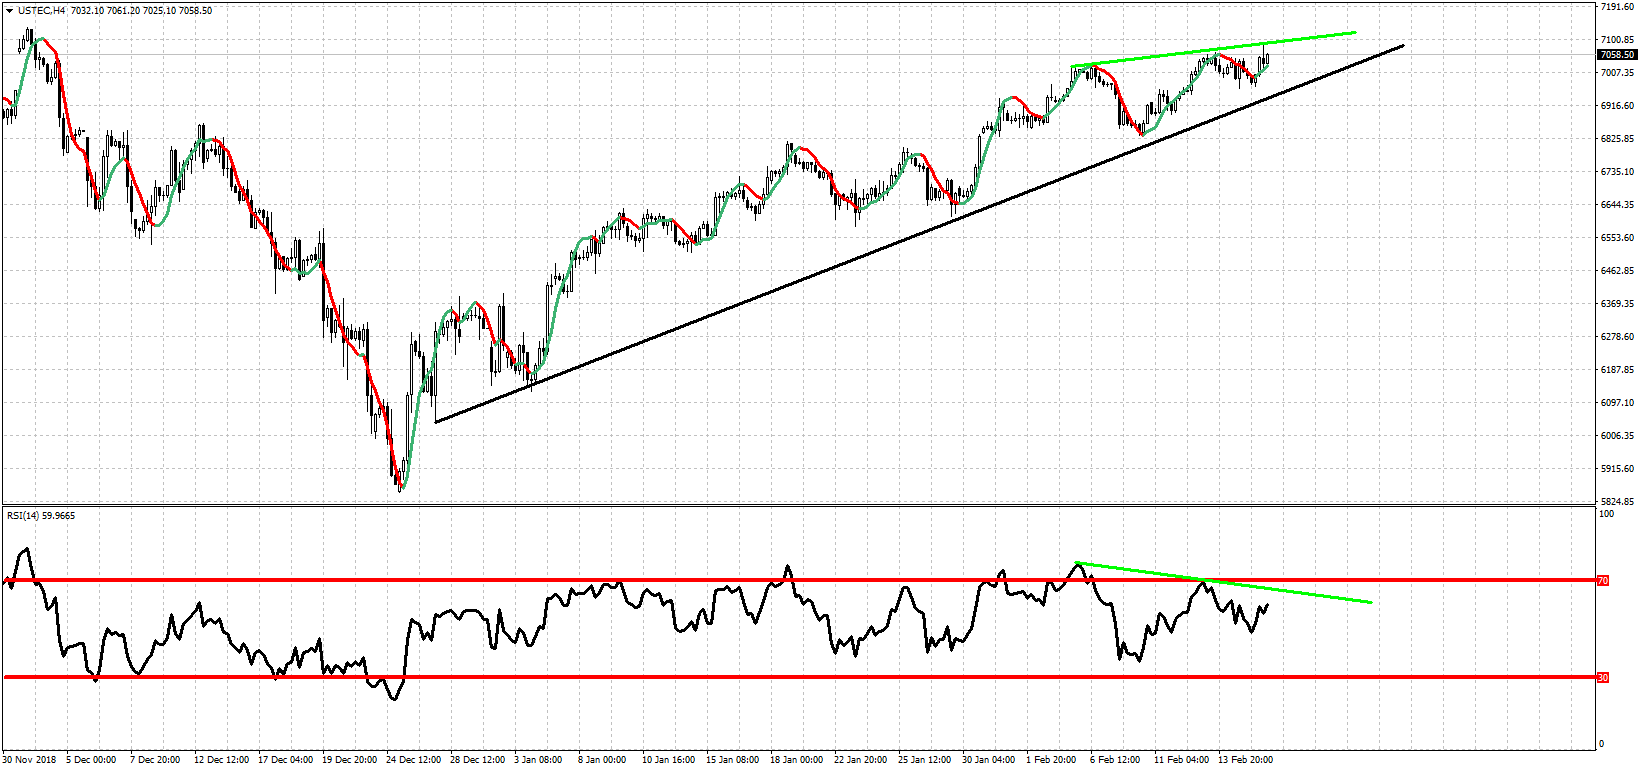
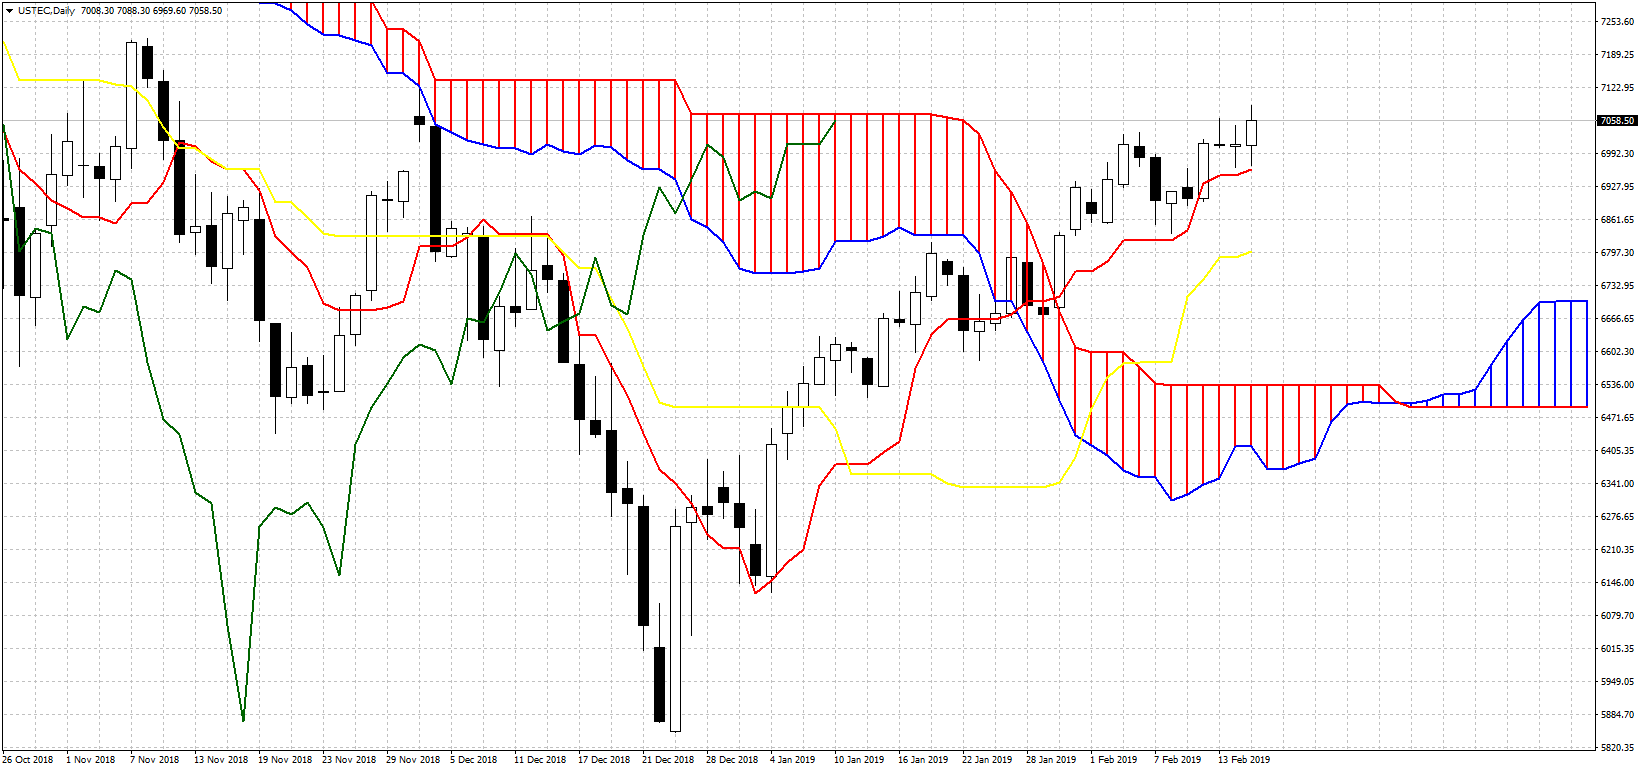
Similar to SPX. Expecting a pull back towards cloud support here as well.
USTEC Daily Chart USTEC 4 Hour Chart

Upside target is at 7175. Support is at 6980-6960.

Disclosure: None of the information or opinions expressed in this blog constitutes a solicitation for the purchase or sale of any security or other instrument. Nothing in this article constitutes investment advice and any recommendations that June be contained herein have not been based upon a consideration of the investment objectives, financial situation or particular needs of any specific recipient. Any purchase or sale activity in any securities or other instrument should be based upon your own analysis and conclusions.

Latest comments

Loading next article…
Risk Disclosure: Trading in financial instruments and/or cryptocurrencies involves high risks including the risk of losing some, or all, of your investment amount, and may not be suitable for all investors. Prices of cryptocurrencies are extremely volatile and may be affected by external factors such as financial, regulatory or political events. Trading on margin increases the financial risks.
Before deciding to trade in financial instrument or cryptocurrencies you should be fully informed of the risks and costs associated with trading the financial markets, carefully consider your investment objectives, level of experience, and risk appetite, and seek professional advice where needed.
Fusion Media would like to remind you that the data contained in this website is not necessarily real-time nor accurate. The data and prices on the website are not necessarily provided by any market or exchange, but may be provided by market makers, and so prices may not be accurate and may differ from the actual price at any given market, meaning prices are indicative and not appropriate for trading purposes. Fusion Media and any provider of the data contained in this website will not accept liability for any loss or damage as a result of your trading, or your reliance on the information contained within this website.
It is prohibited to use, store, reproduce, display, modify, transmit or distribute the data contained in this website without the explicit prior written permission of Fusion Media and/or the data provider. All intellectual property rights are reserved by the providers and/or the exchange providing the data contained in this website.
Fusion Media may be compensated by the advertisers that appear on the website, based on your interaction with the advertisements or advertisers.
© 2007-2024 - Fusion Media Limited. All Rights Reserved.