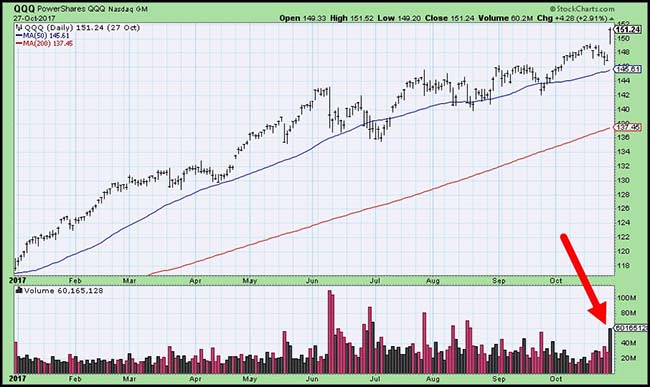
Did last week’s blowout earnings just throw a halo on the equity market? It sure as heck felt like it. Those that have worked with me, or have read my market missives over the last several years, know that I like to listen to (and not fight) the market. And I am pretty sure that on Friday, the market was using a bullhorn to scream in my ears. Just look at that volume spike (see below) in the Nasdaq 100. This tells me that there were many investors caught flat footed and under-invested in the big cap tech names that blew out their sales and earnings on Thursday night. Alphabet (NASDAQ:GOOGL) beat revenues by $400m, as did Intel Corporation (NASDAQ:INTC). Microsoft Corporation (NASDAQ:MSFT) beat by $1b and Amazon by $1.8b. Looks to me that the U.S. economy is doing just fine and these four companies have the right products and services to take advantage of it.
Treasury Bond yields look like they want to break higher, and more so in the event any progress can be made on tax reform. But with all the lobbying and discontent in Congress combined with the lack of specific tax item leadership from the White House, I remain skeptical that anything of importance will make it to a bill. So, bring on the new Fed announcement, which will give the TVs something to talk about and the bond markets something about which to speculate. I’m going back to look at corporate earnings because the equity markets are much more fun right now.
A Thursday afternoon and Friday that won’t be soon forgotten…
For one day at least, it felt like 2000 again in the U.S. stock market.
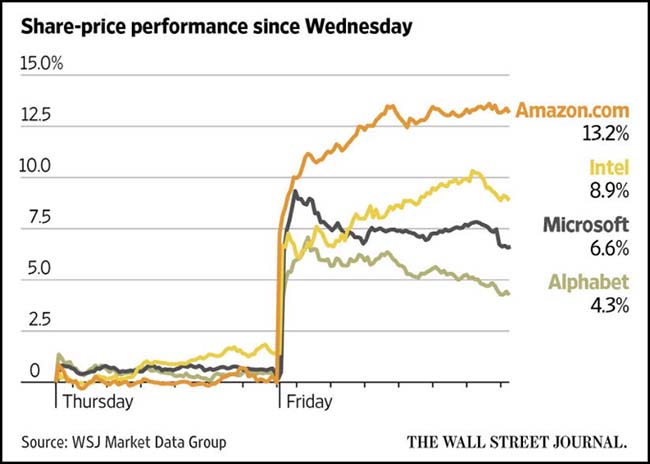
A swell of enthusiasm for shares of America’s best-known technology and internet companies carried the Nasdaq Composite Index to another record, up 2.2% in its biggest one-day point gain since August 2015.
The headiest gains were in Amazon.com Inc (NASDAQ:AMZN)., Google parent Alphabet Inc., Microsoft Corp (NASDAQ:MSFT), and Intel Corp (NASDAQ:INTC). The surge in those shares added a collective $146 billion in market value to the companies. That one-day rise eclipsed the entire value of International Business Machines (NYSE:IBM), at $143 billion.
Several of last week’s earnings comments were quite encouraging for the overall economy…
“We’re seeing broad-based sales increases across a number of industries in all regions. We continue to see strength in China construction. Onshore oil and gas in North America is also strong. Construction activity in North America was up compared to last year, and we’re seeing increased order activity by mining customers.” — Caterpillar (NYSE:CAT) (Construction Equipment)
“Industrial demand remains strong…I would say that certainly the demand was broad based. If you look across our product lines, we’ve got 65 to 70 different product lines, and the demand was very strong across those as well as strong across the region. So we had revenue up in three of the four regions year on year in Europe, Asia and the U.S., and it was about even in Japan.” — Texas Instruments (NASDAQ:TXN) (Semiconductors)
“Clearly we’re seeing clients starting more new projects. They’re spending more money. They have more sense of urgency. Their existing staff has a lean because they’ve held a line so far during this recovery. So, there’s some pent up demand that results from that.” — Robert Half (Temp Staffing)
“The labor market in the U.S. is extremely tight, hard to find people.” — Manpower (Temp Staffing)
“The core underlying market we’re facing for raw materials is certainly toughening.” — 3M Company (NYSE:MMM) (Industrial)
“We knew we’d see higher pulp cost going into year, these costs have continue to increase beyond initial forecast ranges. Ethylene, propylene, kerosene, and the polyethylene and polypropylene resins have increased recently” – Procter and Gamble (Consumer Products)
“Given the level of destruction of capital give or take $100 billion vaporizing in a relatively short period of time…it is hard for us to imagine that given the loss activity it is not going to be a definitive wake-up call for market participants and capital providers to focus more deeply or to revisit what is an appropriate risk-adjusted return.” — WR Berkley (Insurance)
(Avondale AM)
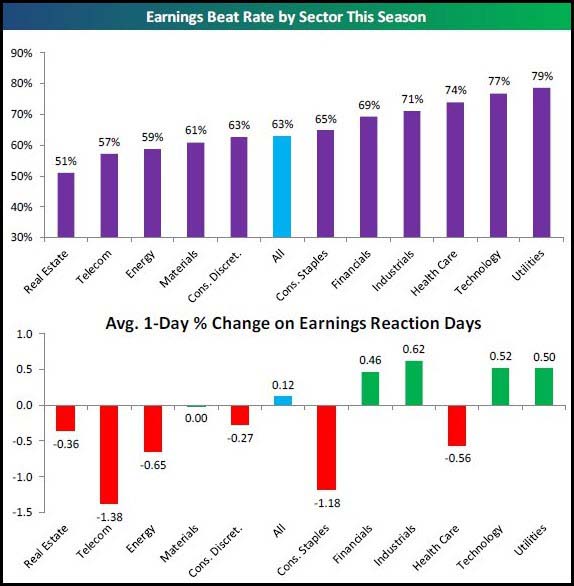
Nice to see that earnings beats are being rewarded…
(@bespokeinvest)
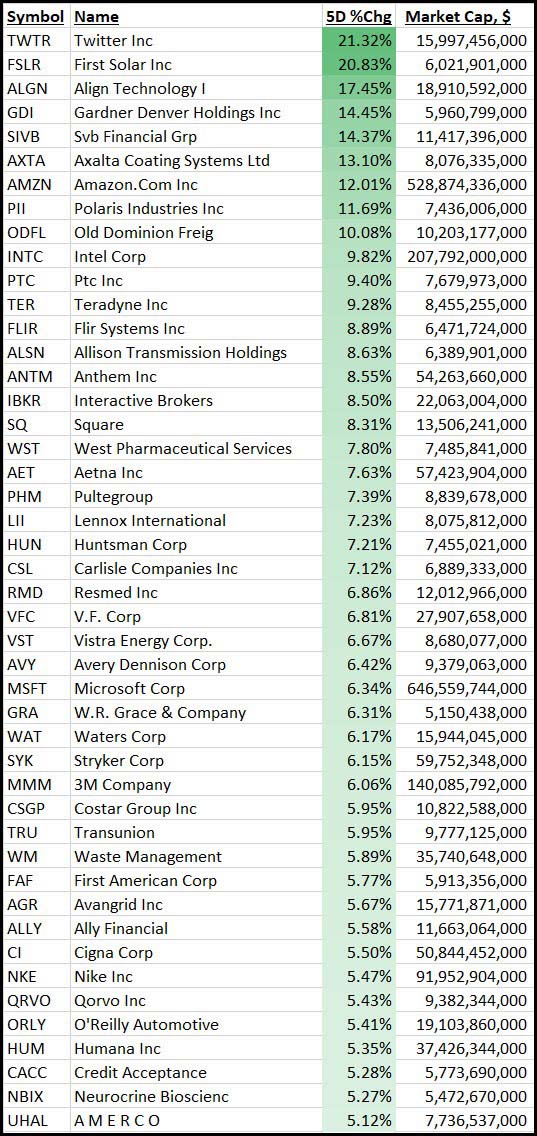
Let’s take a look at last week’s equity dispersion…
There were 46 large cap stocks in Russell 1000 Index that gained 5%+ last week…
(10/27/17)
…but there were 67 large cap stocks in Russell 1000 Index that fell 5%+ last week!
How is this market not one of the best stock picking environments that we have ever witnessed?

(10/27/2017)
For the week, it was all about the Nasdaq 100 and the U.S. dollar.
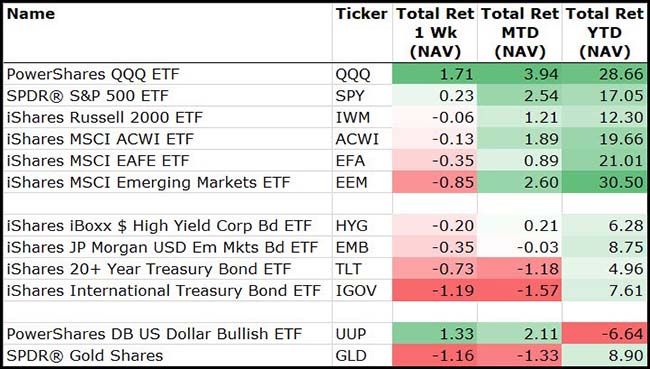
(10/27/17)
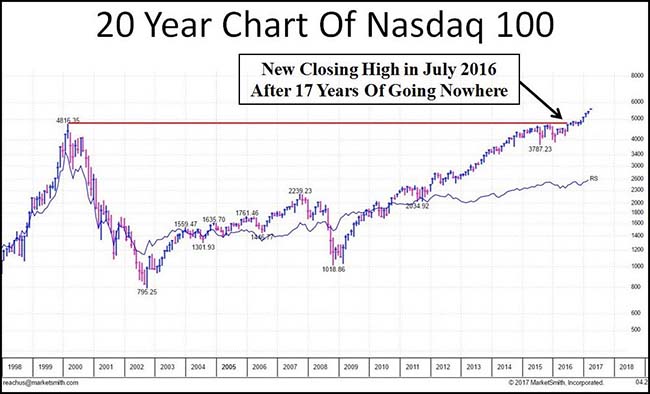
Keeping the Nasdaq100’s performance in perspective…
@jfahmy: People who say this market has gone on too far forget that the Nasdaq went nowhere for 17 years.
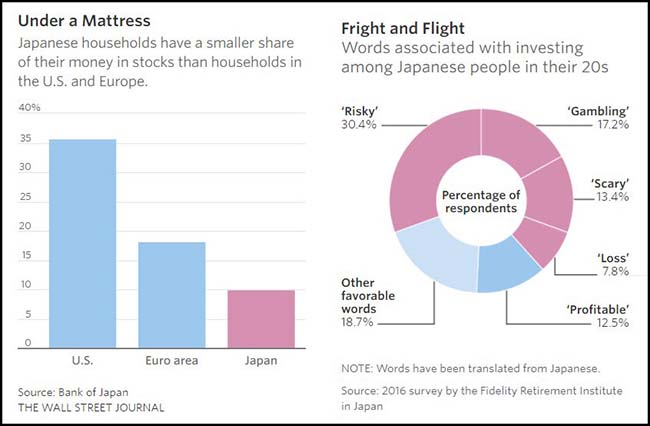
How can you not be overweight Japan after reading this article?
Even a recent surge in the Nikkei Stock Average, which stands at a 21-year high after a record 16 straight days of gains, has generated little enthusiasm. For most Japanese, the trauma of the early 1990s bubble collapse, when the leading stock average fell more than 60% in less than three years, was enough to drive them out of the market.
Japan’s situation is a reminder of how hard it can be, even in a rising market, to build the kind of investing culture Americans are accustomed to. Only 10% of households in Japan own equity, compared with 36% in the U.S., according to the Bank of Japan…
More than half of Japan’s household wealth sits in bank deposits or cash under the mattress, according to the Bank of Japan, compared with 14% in the U.S.
“We have to increase our assets. Otherwise we cannot survive in a super-aged society,” said Satoshi Nojiri, director of the Fidelity Retirement Institute in Japan.
In a survey of 10,000 salaried people in their 20s through 50s last year by the Fidelity institute, more than 60% used words like “risky,” “scary” and “gambling” to describe investing. Among those in their 30s, fewer than one in eight said they were actively investing for retirement.
(WSJ)
Among the sectors last week, it was Technology that ran the table…
Even Consumer Discretionary did well since its largest position is Amazon.
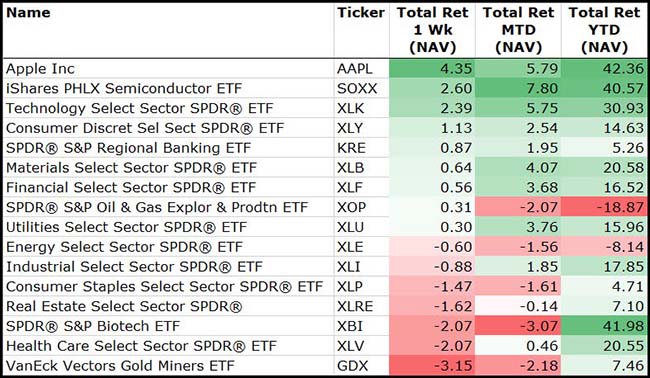
(10/27/17)
But for Healthcare, the drug and biotech stocks look sick…
All of a sudden, the bull market has left the drug industry behind.
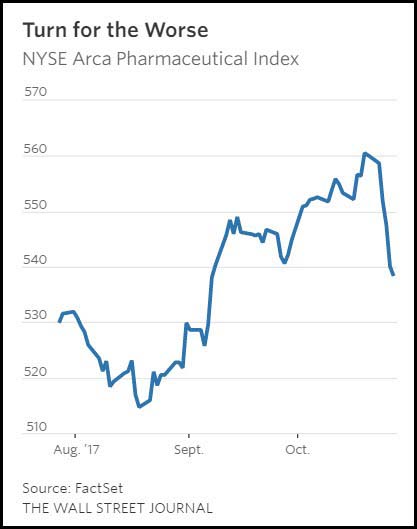
This earnings season has an unhappy one for pharma investors. The NYSE Arca Pharmaceutical Index is down more than 5% over the past three weeks. The damage looks worse under the surface.
While there have been some bright spots, at least 10 major drugmakers have traded lower after reporting earnings so far this month, according to FactSet. Some of these declines have been significant. Merck (NYSE:MRK) sold off by 6% on Friday after earnings. Celgene (NASDAQ:CELG), one of the stronger stock performers in recent history, collapsed by nearly 20% on Thursday and fell further on Friday.
Interestingly enough, nine of these companies, including Merck and Celgene, beat the quarterly analyst estimate for adjusted earnings per share. But the companies cast doubt about their long-term prospects.
(WSJ)
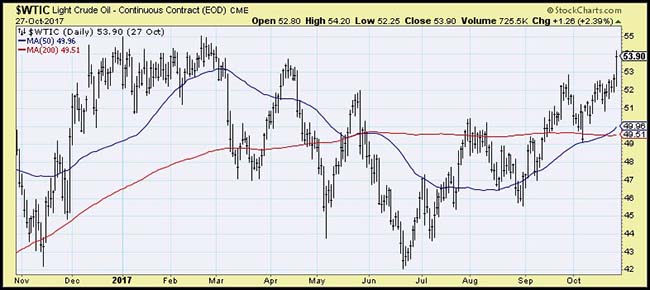
Your energy stocks may still be underperforming, but something is up with the underlying commodity, which broke higher on Friday.
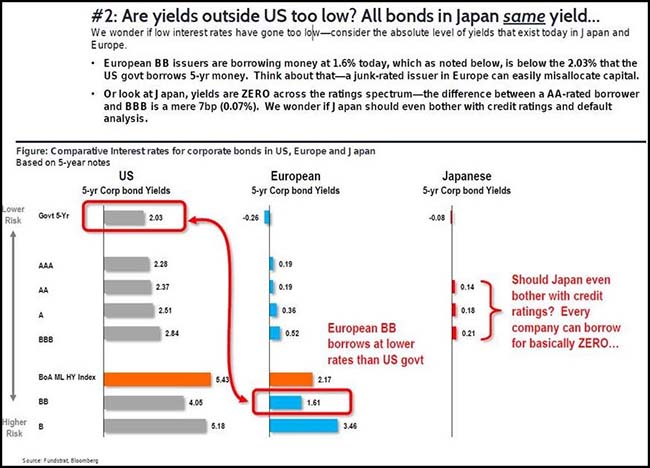
If you are wondering how U.S. bonds could be so well bid given the economic strength and rising cost data points…
Take a look at the bond yield comparables in Europe and Japan. Five-year U.S. Treasuries yield more than Euro BB Corporate Bonds. So it is going to take a lot to shake out global investors from U.S. bonds.
(@DriehausCapital)
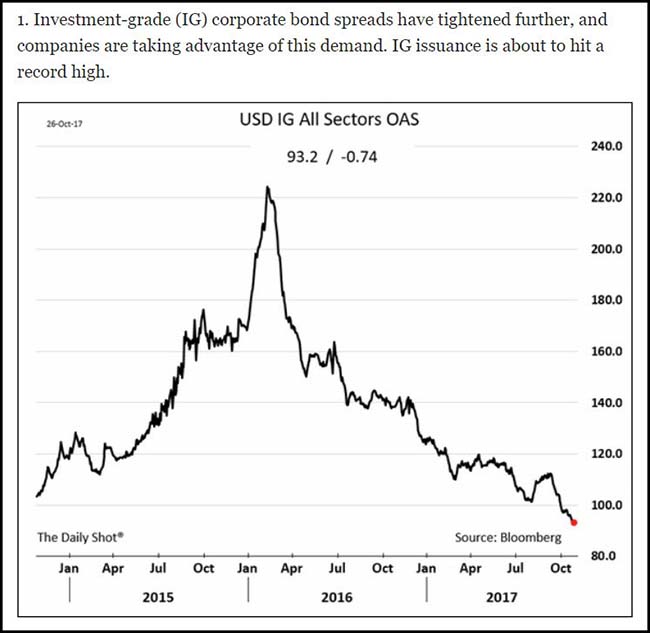
Just another reminder that credit is nearly free to all high quality issuers.
(Daily Shot/WSJ)
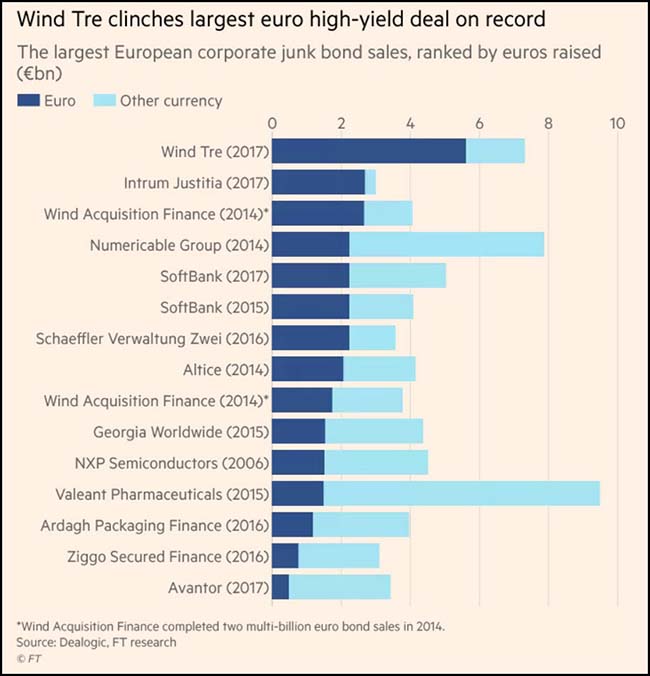
…and even low quality issuers in Europe…
Italian telecoms group Wind Tre on Tuesday clinched the largest euro junk debt sale on record as the company braces for renewed competition from the looming arrival of Iliad in Italy. The wireless carrier borrowed the equivalent of €7.325bn and attracted heavy investor demand, according to three people involved in the deal, as money managers scramble for interest-bearing assets. The sale drew investor orders of €25bn, one of the people said, allowing bankers to cut short the final leg of marketing roadshows planned for Tuesday.
(FinancialTimes)
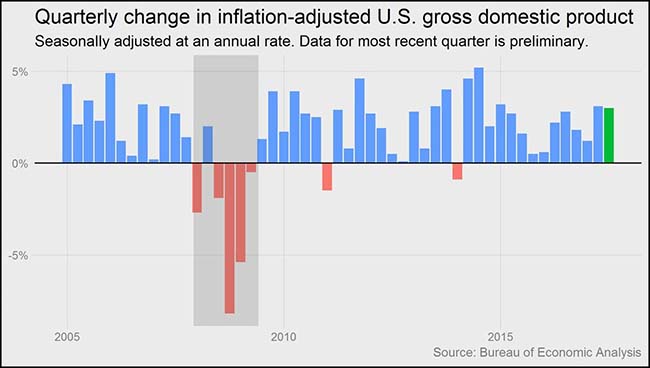
Q3 U.S. GDP last week reflects much of what we are reading and hearing on the corporate earnings conference calls…
@bencasselman: This is the first time the U.S. has had consecutive quarters of 3+% growth since 2014.
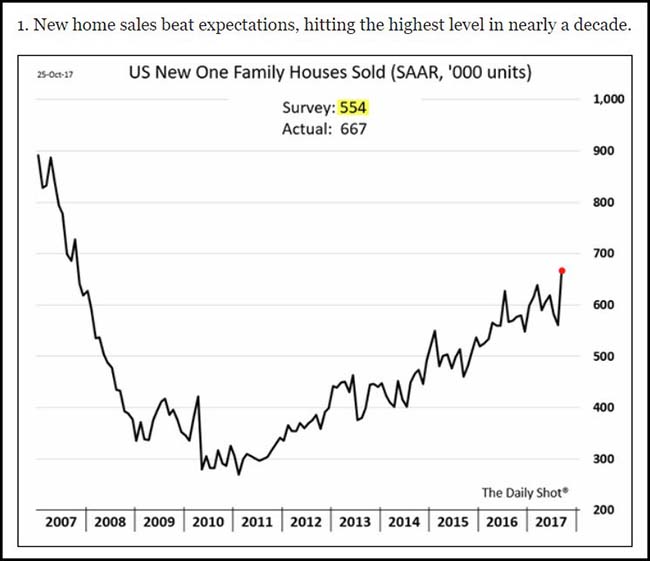
New home sales continue to surge.
(Daily Shot/WSJ)
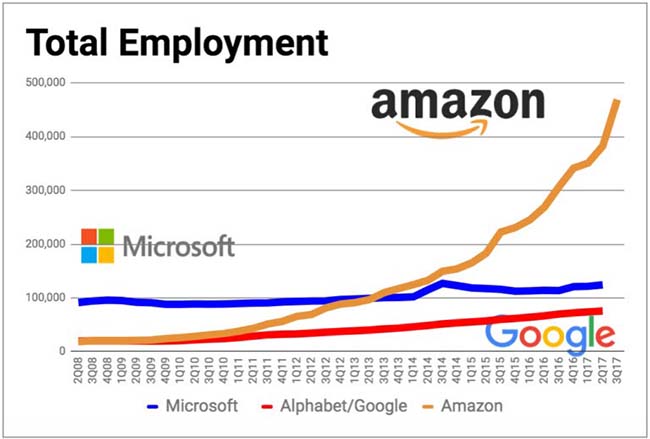
It seems almost perfect that the wealthiest American has 1) created the most number of American jobs and 2) significantly lowered prices to all Americans.
In its most recent earnings report, the company said it employed more than 380,000 people worldwide.
That number does not include 87,000 employees from Whole Foods, the grocery giant that Amazon acquired last month. With the acquisition closed, Amazon now employs more than 467,000 people — an astonishing number given that the company reported just 20,000 employees at this time nine years ago, and 81,000 five years ago. It also makes Amazon the country’s second-largest employer behind Walmart (NYSE:WMT).
Adding another 50,000 employees at the second headquarters would push Amazon’s headcount past 500,000. That milestone will likely be eclipsed before then, though.
Earlier this year, Amazon said it planned to add another 100,000 full-time jobs in the U.S. by mid-2018, growing its domestic workforce by 55 percent. And in July, it said it would hire another 50,000 people to work in its fulfillment centers, with 80 percent of the openings for full-time roles.
There are also more than 17,000 open positions on Amazon’s jobs site.
(GeekWire)
Speaking of Amazon, a creative idea for their new Amazon Key home delivery service.

Finally, have a great Halloween.
The information presented here is for informational purposes only, and this document is not to be construed as an offer to sell, or the solicitation of an offer to buy, securities. Some investments are not suitable for all investors, and there can be no assurance that any investment strategy will be successful. The hyperlinks included in this message provide direct access to other Internet resources, including Web sites. While we believe this information to be from reliable sources, 361 Capital is not responsible for the accuracy or content of information contained in these sites. Although we make every effort to ensure these links are accurate, up to date and relevant, we cannot take responsibility for pages maintained by external providers. The views expressed by these external providers on their own Web pages or on external sites they link to are not necessarily those of 361 Capital.
