I did, however, want to share some charts that, on the one hand, suggest the bears (who have suffered horribly over the past five weeks) may be in for more pain, and other charts which suggest that the bulls are about to get what they deserve. Let’s start with the “bad” ones first:
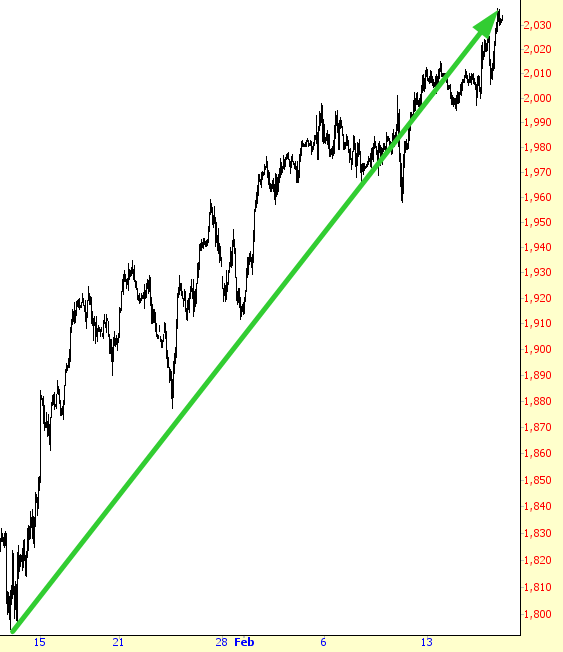
The 13% rally we’ve seen since February 11th has been – – how shall I put this? – – horrible. Here’s the ES, which has teased bears here and there with dips, which are shallower and shallower:
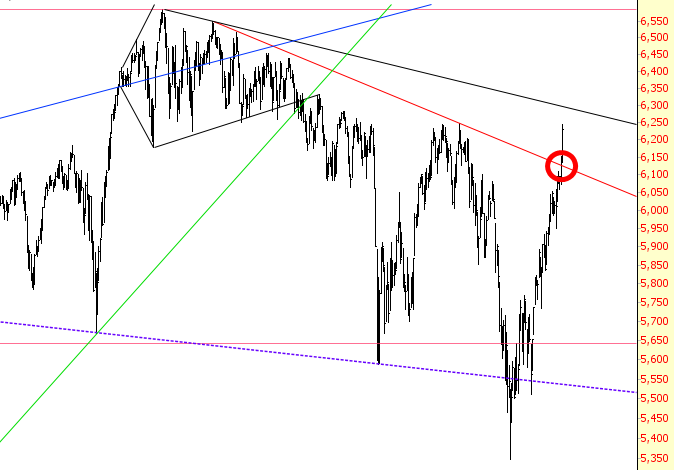
The Dow Composite, which I pointed out yesterday had slightly violated its trendline, has very much violated the same trendline today. Our old fishy friend is threatening to betray us.
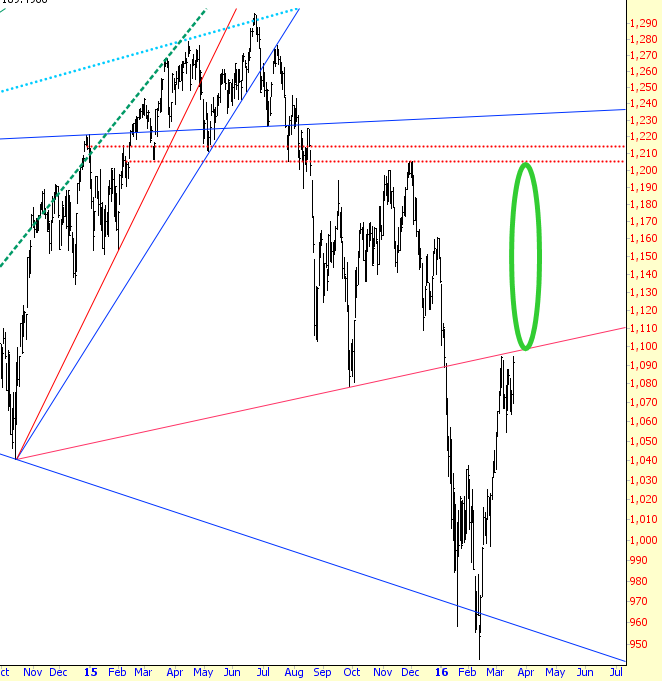
And although not bad yet, the Russell is terribly close to crossing above a trendline that I’d rather it not cross.
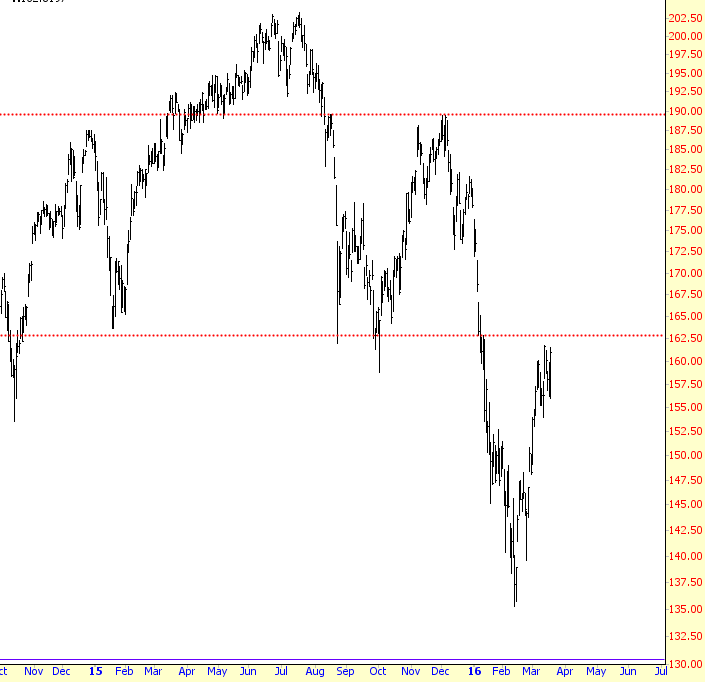
OK, enough of that. Let’s see some bearish charts. Most of these bear the redeeming feature of still being bearish and un-violated (which, of course, some speech from a central banker would wreck). Here’s the broker/dealer index:
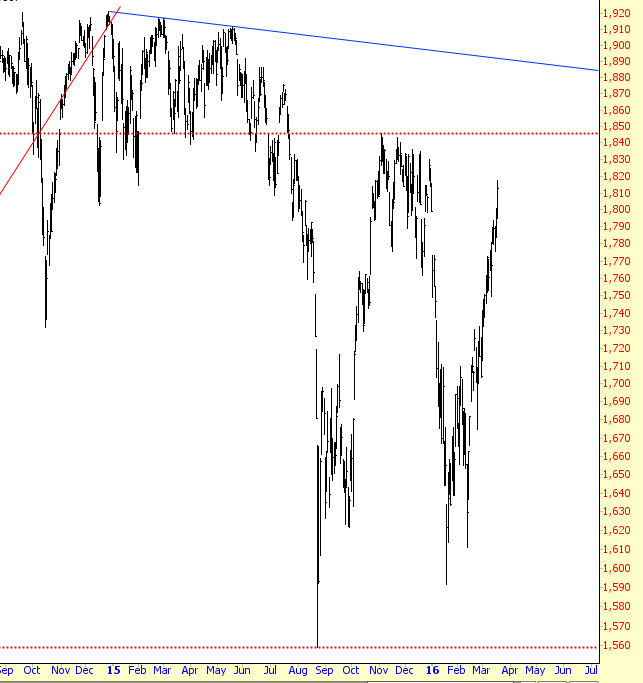
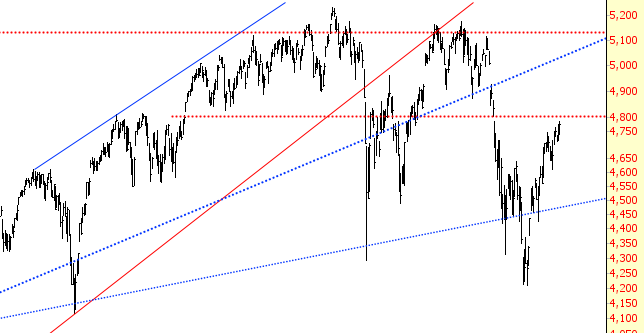
The major market index, which is still sporting lower highs…….
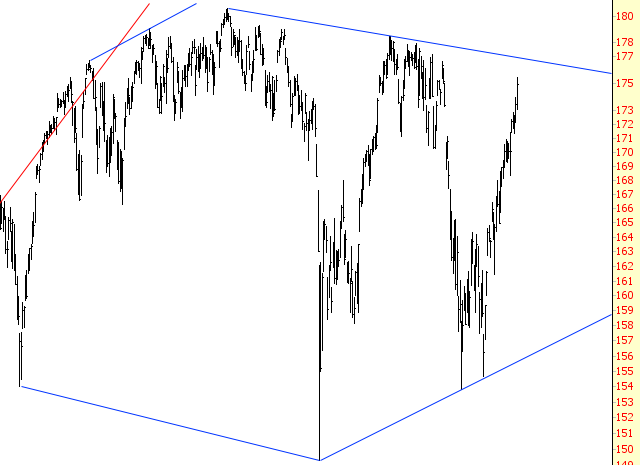
The Dow 30 “diamonds” have, as I’ve pointed out in dedicated posts, a very clean diamond topping pattern:
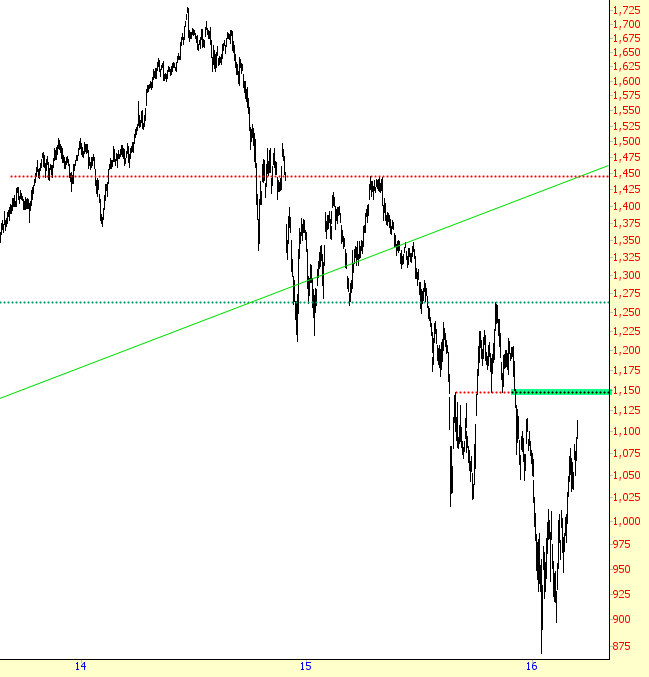
The oil/gas index, in spite of crude’s amazing strength, has seen these kinds of countertrend rallies before. It might NOT be different this time you know.
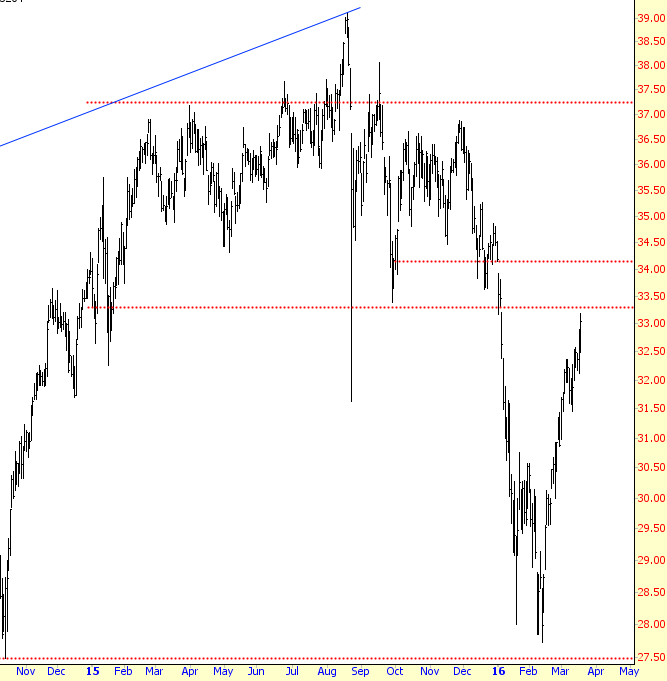
The homebuilders (SPDR S&P Homebuilders (NYSE:XHB)) are terrific-looking still:
And the NASDAQ Composite is still quite vulnerable (hat tip to Amazon (NASDAQ:AMZN) and Apple (NASDAQ:AAPL)).
If the market gods are reading this, how about giving the bears a break on Friday, huh? They could use it. At least think about it.
