With the correction in global stock markets still running its course, it's worth surveying some valuation statistics across developed market (DM) equities. Indeed, the current correction could easily go further, purely on sentiment, and in the process cheapen valuations across the board. But in the meantime, this article takes a snapshot of the bottom end of DM equity valuations.
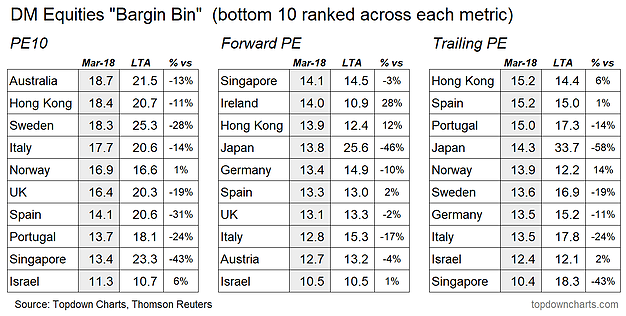
The table below comes from a broader discussion on developed market equity valuations in the latest Weekly Macro Themes report and shows the lay of the land in the bottom 10 ranked countries within DM.

The table looks specifically at 3 different versions of the PE (price/earnings) ratio - a key equity market valuation indicator. First is the PE10 (price divided by 10-year average earnings), then the Forward PE (price divided by consensus next 12-month earnings from the Thomson Reuters I/B/E/S data set), and the Trailing PE (price divided by the last 12-month's earnings). Each reading is shown next to its longest available historical average, and the final column shows the percentage premium/discount vs long term average.
There are some slight differences across the tables as each indicator gives a slightly different signal, yet the common mentions on the bottom half of the table are: Israel, Singapore, Italy, UK, Germany, Portugal, Spain.
Notably, a number of those on the bottom end of the valuation rankings are European countries, and this makes some sense as I previously noted how European countries are among the culprits responsible for the weaker global equity breadth stats.
However, thinking about the macro backdrop in Europe, it's a contrasting picture. On the one hand, numerous indicators point to solid economic conditions, or at least buoyant economic confidence, and lending conditions are very easy, as are credit spreads and borrowing rates. Yet, the direction the ECB is heading is away from extremely easy and on a gradual path to normalization. Geopolitical risk remains an ever present specter, but it begs the question whether these risks are in the price.
In any case, the tables in this article go to show that while there are some relatively expensive looking markets such as the S&P 500 and NASDAQ, there are still certainly pockets of relative value out there across countries.
