Stocks globally continue to struggle, and the struggles have been ongoing. It marks a turn in market sentiment, which is hard to ignore. Markets tend to move a group, with the ebbs and flow moving from one trading to session to the opening of the next session. Each of the major markets each seems to have a bit of there own tale to tell, but indicate the same sentiment, which appears to be a move to risk-off.
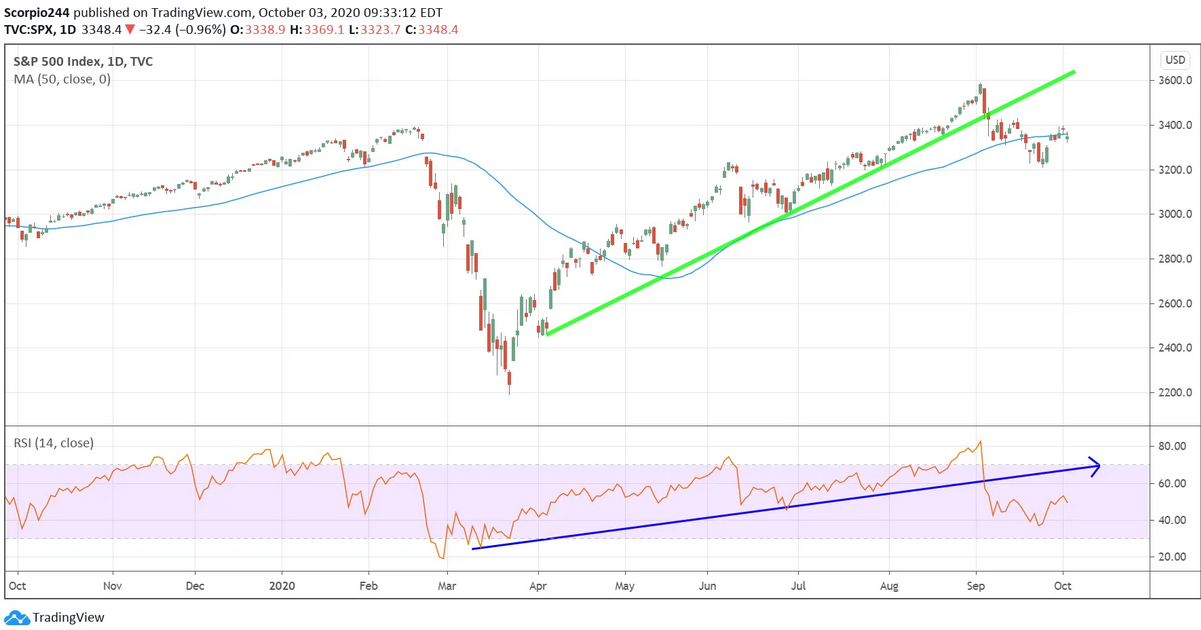
The S&P 500 tends to be the market that most global markets follow, and the weakness since the beginning of September is hard to miss, down over 7%. It is a significant shift in momentum since August when the markets seemingly only went up. But the significant change came when the S&P 500 broke its major uptrend broke, along with a substantial shift in the direction of the relative strength index.
With momentum in the index broken, it suggests the S&P 500 may have further to drop. An open gap around 2,860, is likely to be the target.
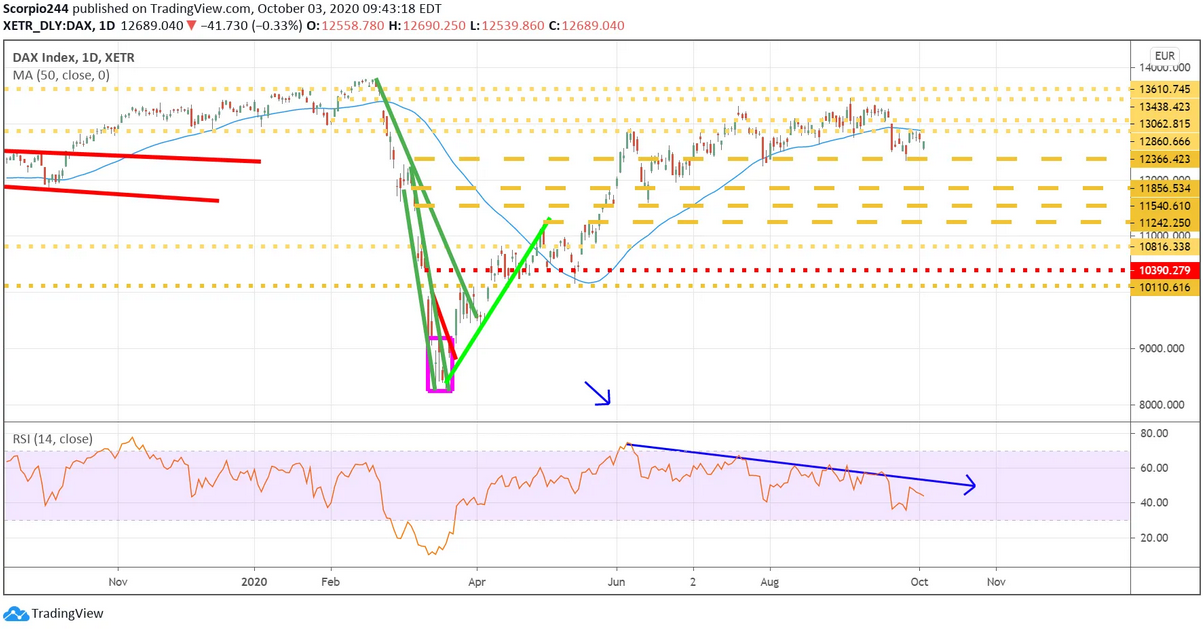
Germany (EWG)
We can see the same type of price action that has taken place in Germany, with the DAX rolling over around the middle of September. That index is down about 5% since the middle of September. But more importantly, it has been losing momentum with an RSI trending and diverging from the DAX price action since the beginning of June.
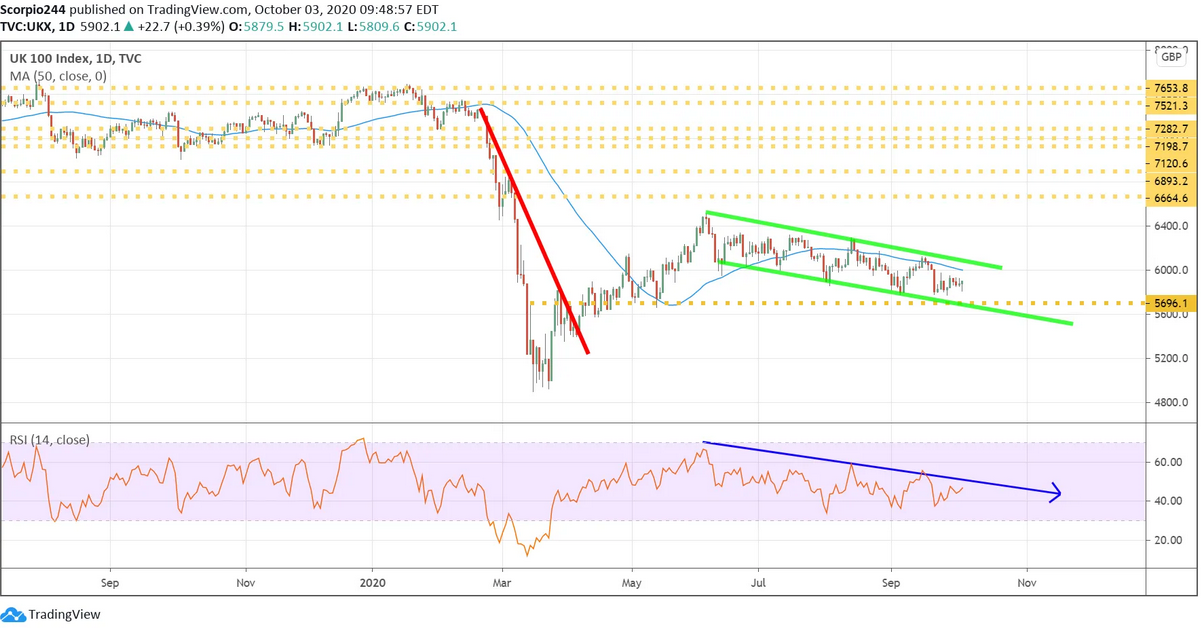
We have seen a similar type of weakness in the UK FTSE, which has been trending lower since peaking on June 8. Again, we have seen the same measure of momentum on the RSI, with a continued trend lower.
Japan (EWJ)
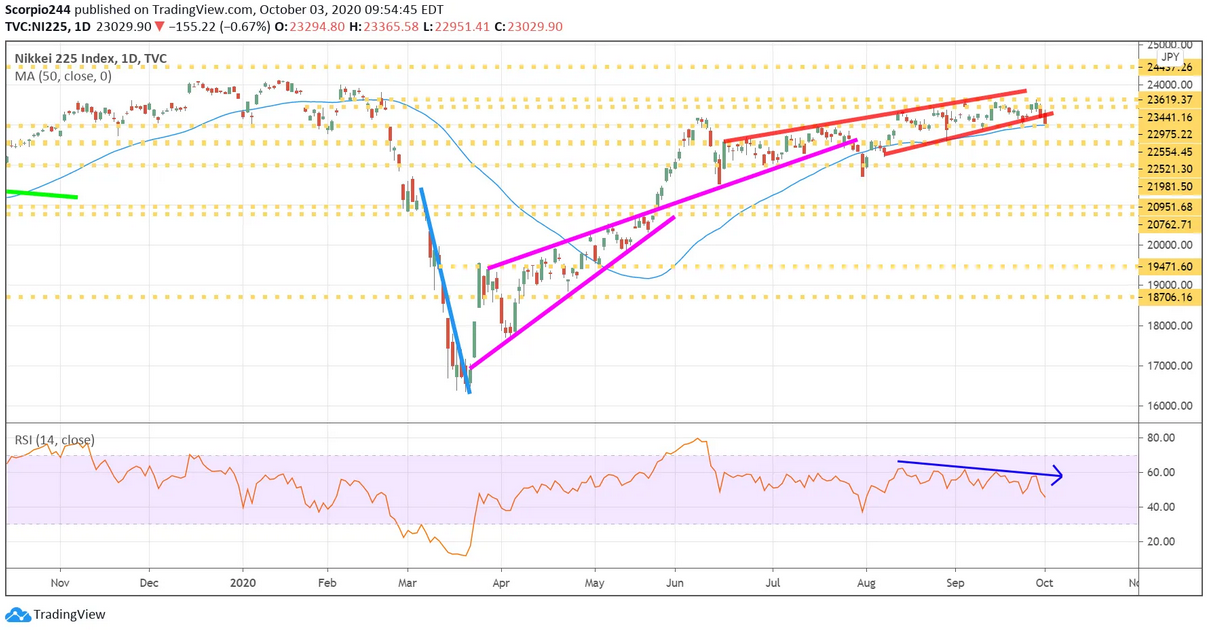
Asian markets have faired better than those of Europe, and perhaps it is due to the higher growth profiles of their economies and the nature of products they produce. Japan has been one of the few markets to suffer recently. However, the Nikkei shows some recent signs of weakness, as it tests its 50-day moving average and has recently fallen below a trend line that has been in place since the beginning of August.
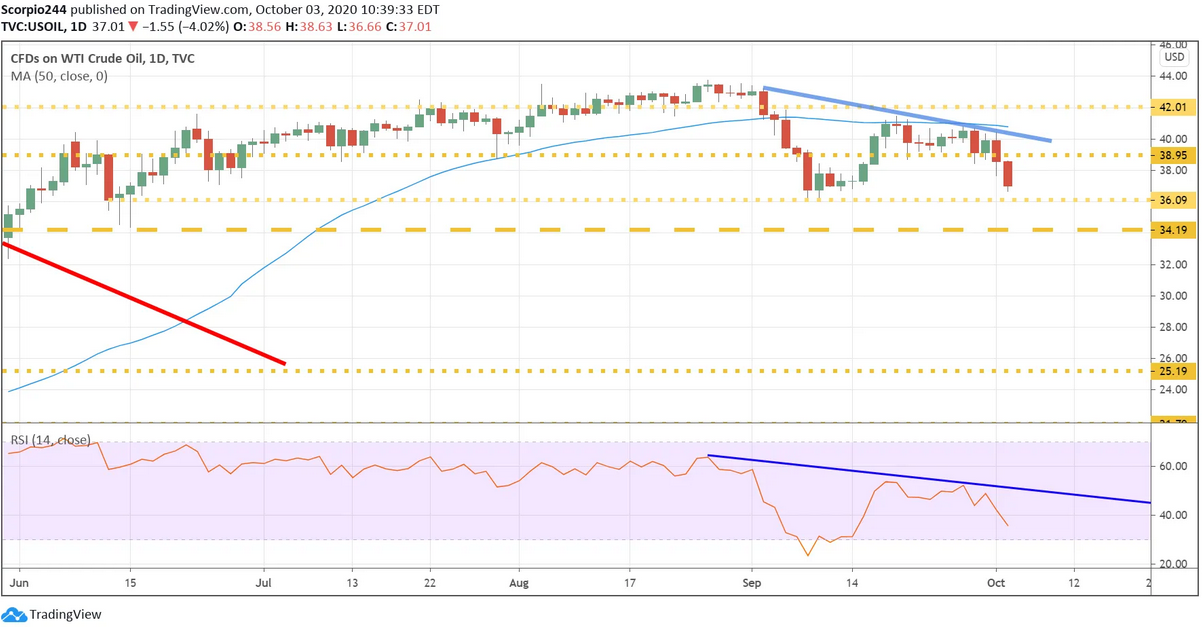
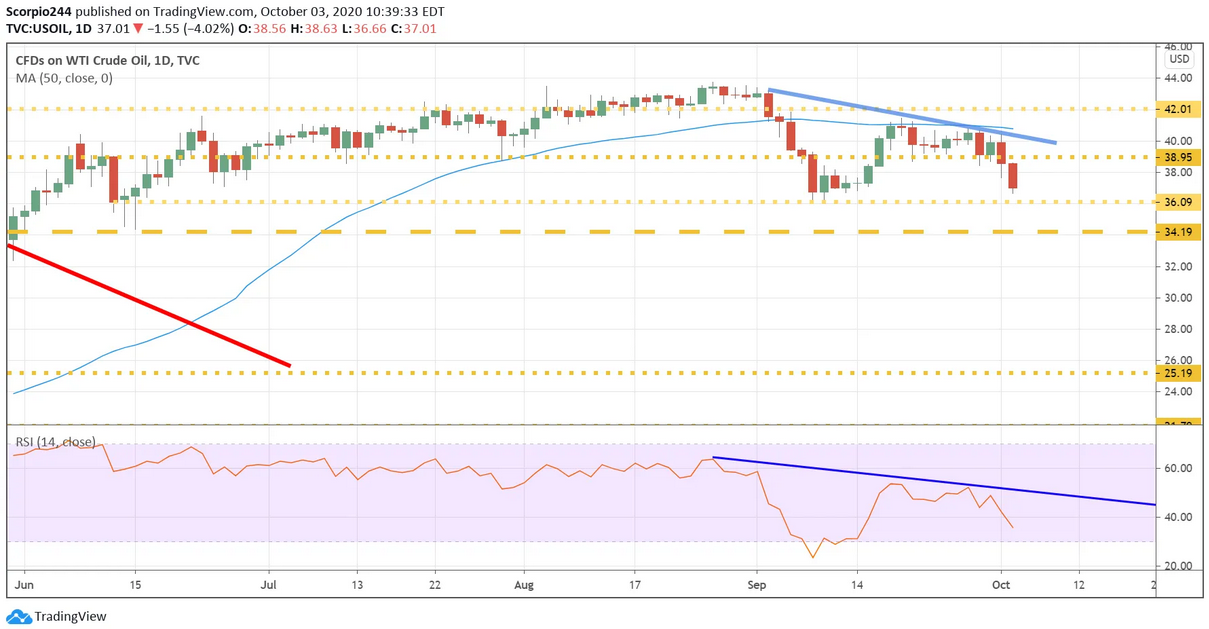
Oil prices have come under pressure, falling by to around $37, dropping nearly 16% since August 26.
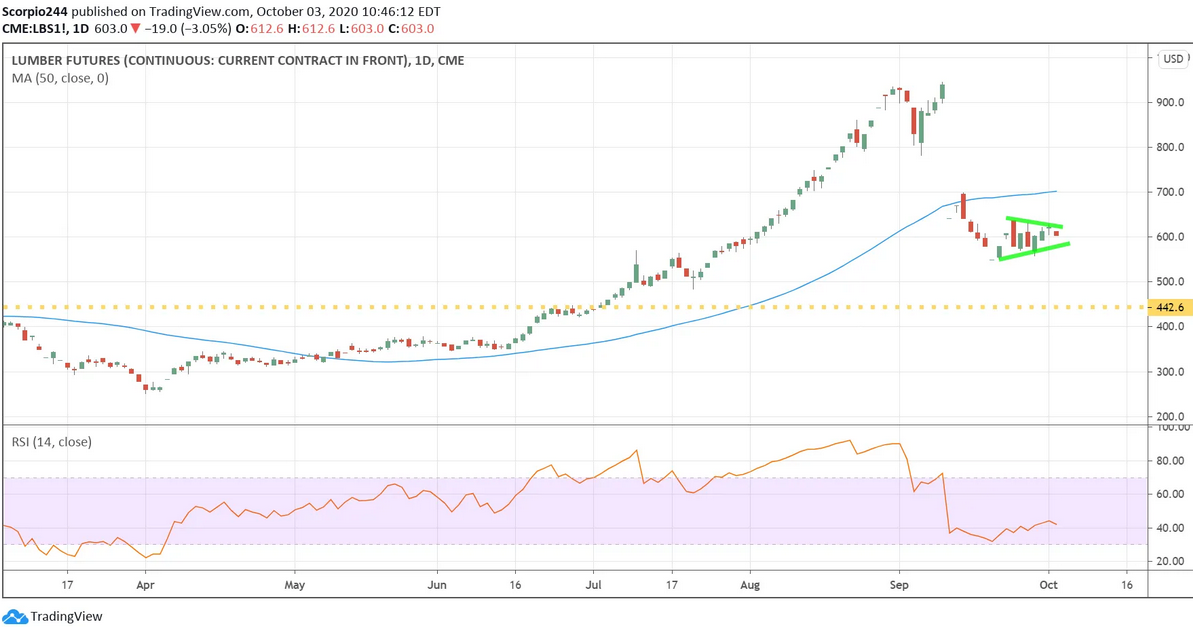
Meanwhile, lumber prices have sharply in recent weeks as well.
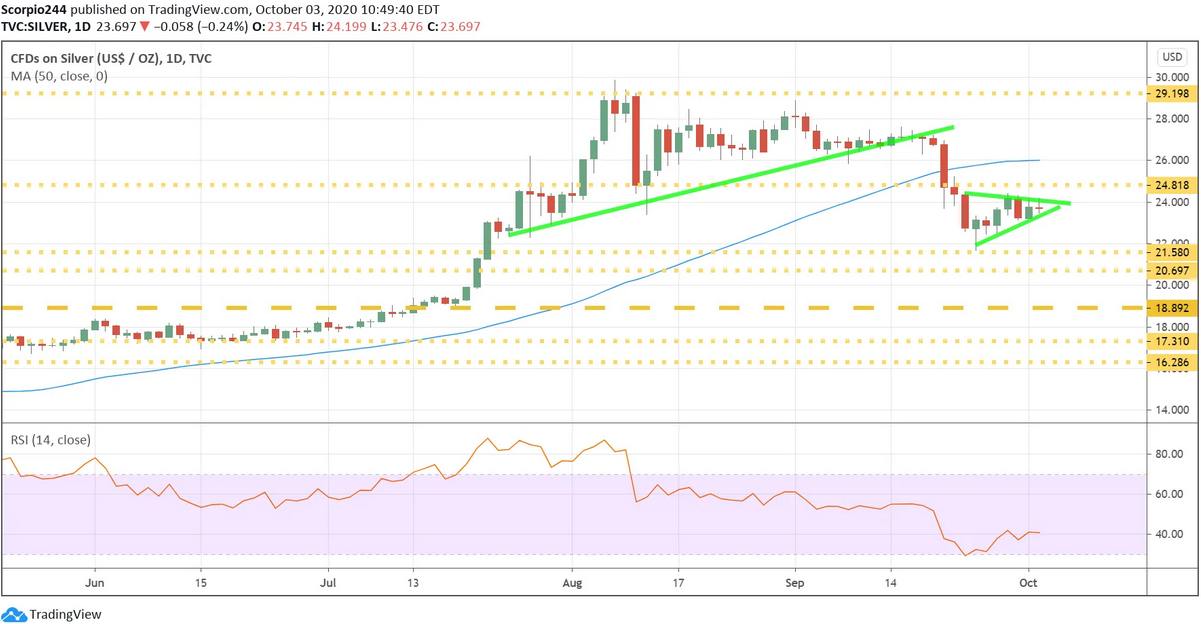
Meanwhile, silver prices have also fallen sharply in recent weeks.
The health of the market at this point seems to appear to directionally be trending lower. The movement around the globe seems to be suggesting a de-risking event taking place. While the drops at this point have been mild to modest, we need to make sure these markets do not begin to suggest a steep decline is coming.
The NASDAQ 100 Analogy continues…
