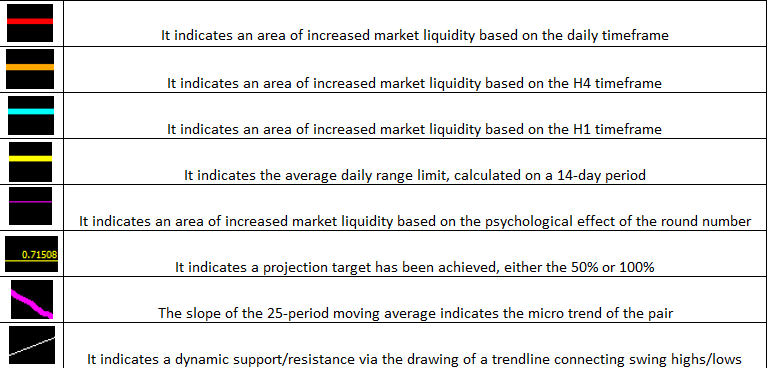
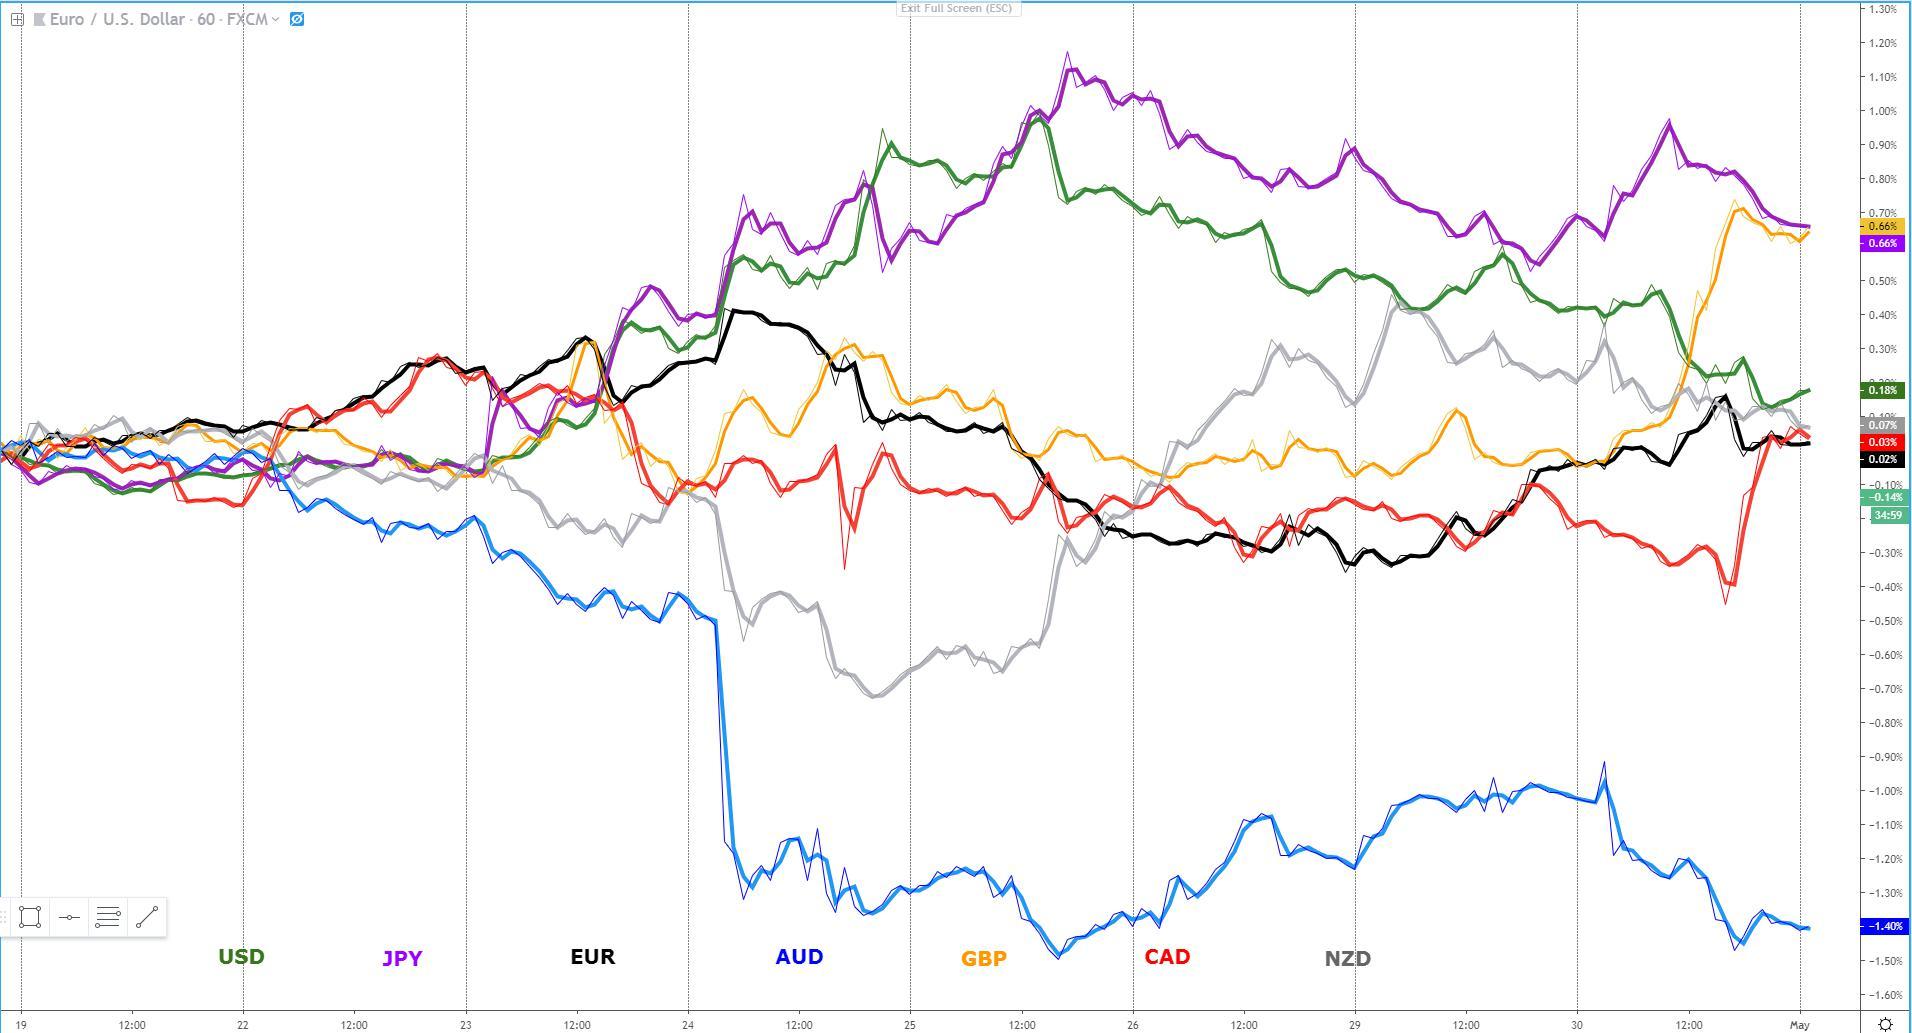
The sterling was on an absolute tear on Wednesday, even as breakthroughs in Brexit are yet to transpire. It's always going to be a harder task to find a clear attribution to the movements seen during the last day of the month, as portfolio re-balancing on unhedged FX positions tend to rule the movements. In the case of the euro, which climbed at a steady pace against the majority of its peers (exc GBP), we can clearly pin down the improved European data as the main reason behind the rally. However, it still feels like the data samples need to be expanded not to think that the solid German CPI or higher EU, Spanish GDPs are mere paybacks for weaker previous data. Nonetheless, if more evidence of a minor recovery in Europe pans out, the ECB will feel in no rush to design further stimulatory policies (EUR positive).
Another currency where we can clearly link its weakness to a particular event is the Aussie, unloved as a China proxy play after the country fell short of expectations in its PMI releases on Tuesday. The Japanese yen did fairly well for half of the day, emboldened by the Chinese poor data, only to revert its buy-side flows as US equities were bought strongly off the lows. The Canadian dollar, notwithstanding a negative GDP for February, exploited the slack by the yen demand deficit late on the day, as BoC Poloz struck a constructive tone on the Canadian economy. Lastly, the two currencies suffering the most included the US dollar and the Kiwi, the latter battered by a miss in NZ jobs. The focus is now shifting in its entirety towards the US ISM release as a barometer of US economic conditions, followed by the FOMC and Chairman Powell presser.
Narratives In Financial Markets
- The USD is broadly weaker even if by taking a look at the DXY, we’ve now reached the 50% Fibonacci retracement level of the bull run originated off 96.80, suggesting that further buying interest to jump on the USD may emerge now that month-end flows are out of the way.
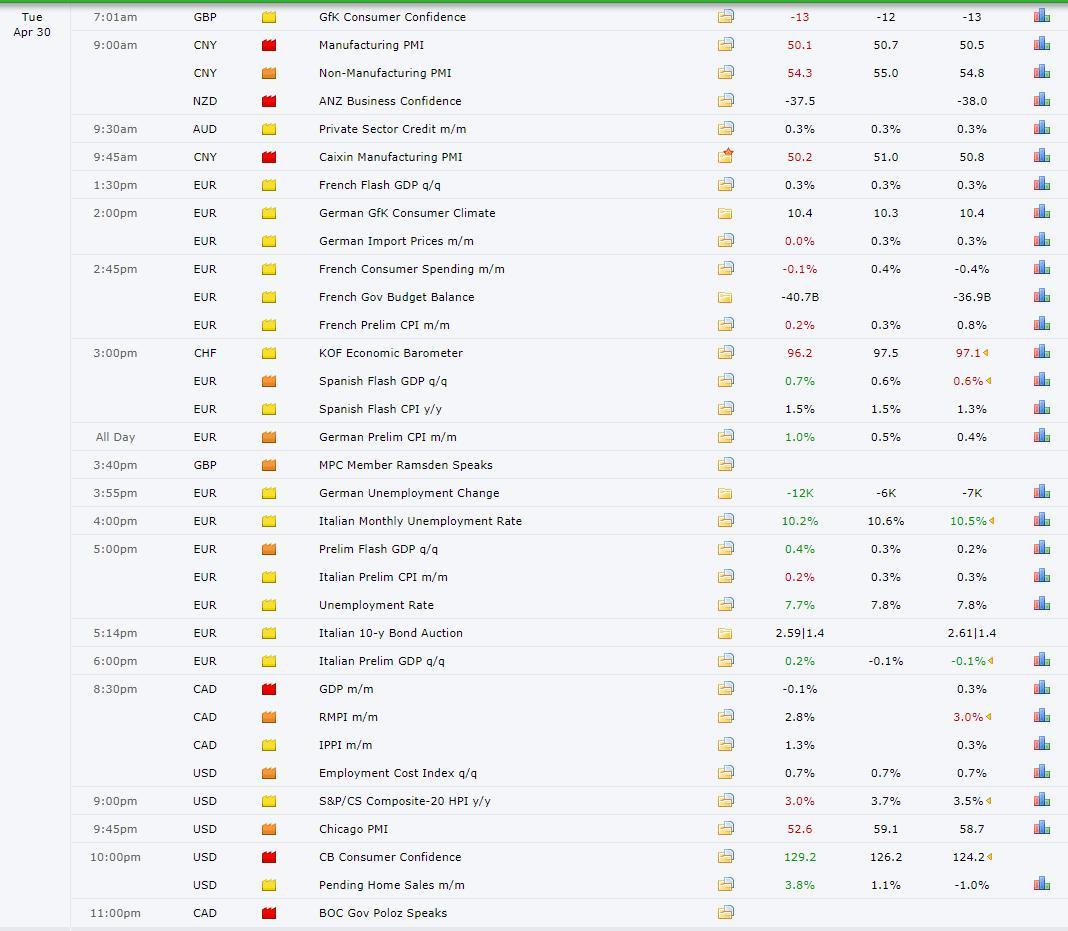
- The euro was propped up following encouraging European data. The Eurozone preliminary GDP came a tad stronger-than-expected, and so did the Spanish. In terms of inflation, Germany’s April preliminary CPI was surprisingly strong at 1% vs 0.5% exp. If follow up positive inputs out of Europe emerge, the ECB may have a rethink and hold off further policy stimulus.
- The Australian dollar was initially sold off on the back of the Chinese PMIs, with both the government official and the Caixin, coming significantly below expectations. The recovery during the European and US session was a function of USD weakness vs own merits.
- The S&P 500 managed to recover early losses by closing 0.1% higher, while the tech-heavy Nasdaq index didn’t get the same love, closing down 0.8%. The disappointing results my Alphabet (NASDAQ:GOOGL), the parent company of Google, weighted on the mood, even if as a contrast, after the bell, Apple (NASDAQ:AAPL) surprised the market with a blockbuster beat that should aid the ‘risk on’ mood.
- In the US, while the Chicago PMI came weak, probably weighted by the Boeing (NYSE:BA) issues, both the consumer confidence and pending home sales came on the strong side. Nonetheless, it didn’t act as a catalyst to invigorate USD bulls, pretty much absent on Tuesday.
- The NZ Q1 unemployment rate fell to 4.2% vs 4.3% exp, despite the poor employment change headline number, which came at -0.2% vs 0.5% exp. The participation rate was also weak at 70.4% vs 70.9% exp, while the average hourly earnings rose by 1.1%, a beat on estimates.
- The UK Labour party has agreed to back a second referendum on Brexit if there is no way out in the current talks with the UK government on May’s divorce deal or through a general election. To recap, in order of priorities, they aim for changes of the standing agreement, followed by elections and if nothing resolves the conundrum, a 2nd referendum.
- The Canadian Feb GDP came at -0.1% vs 0% exp, which seems to compensate the strong number posted back in January when Canada reported a growth of +0.3%. The report falls very much in line with the annual expectations of +1.2% growth the BoC projects.
- In comments to a parliamentary committee, BoC Governor Poloz reiterated that the Central Bank will evaluate the appropriate degree of policy accommodation in coming months, while still sounding optimistic on the prospects of growth in the quarters ahead. The CAD celebrated the speech with a late-day rally.
- The pressure to finalize the US-China trade deal is building up based on the latest commentary by US politicians and the press. White House Chief of Staff Mulvaney came forward saying that the talks must end in a matter of weeks, ‘one way or another’. Remember, the deal is fully priced in, so any minor suggestion that both parties may be headed for an unexpected disagreement would most certainly wreak-havoc stocks and boost the yen. According to the WSJ, the removal of the tariffs at the start of the US-China trade dispute, the enforcement mechanisms, access to agriculture and opening China’s market are the sticking points.
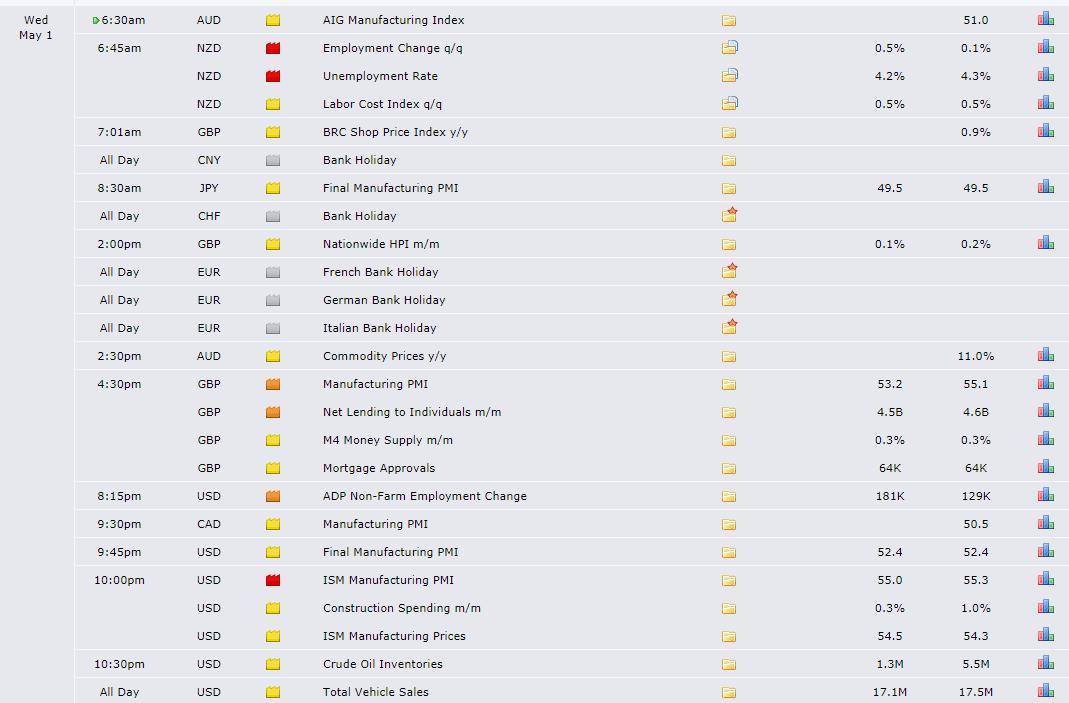
- Many financial centers, including Japan, China, France, Germany, Italy, are having public holidays today, which means thinner-than-usual liquidity until the US comes online.
- We get two major data releases out of the US on Wednesday. As an aperitif, the ISM manufacturing ISM will serve as a barometer to measure the health of the US economy via the relevant insights provided by the company’s purchasing managers. It is considered to be a forward-looking indicator of business conditions, employment, productivity, etc.
- The key event for the day will be the FOMC, including Powell presser afterward. The expectations are for a balanced message on the economy through the statement and the press conference. The Fed has made it clear it aims to stay patient, but with inflation underwhelming below the Central Bank’s mandate, it will be interesting to monitor any remarks about the policy actions planned to combat this low levels of price pressures.
Recent Economic Indicators And Events Ahead
Source: Forexfactory
RORO (Risk On, Risk Off Conditions)
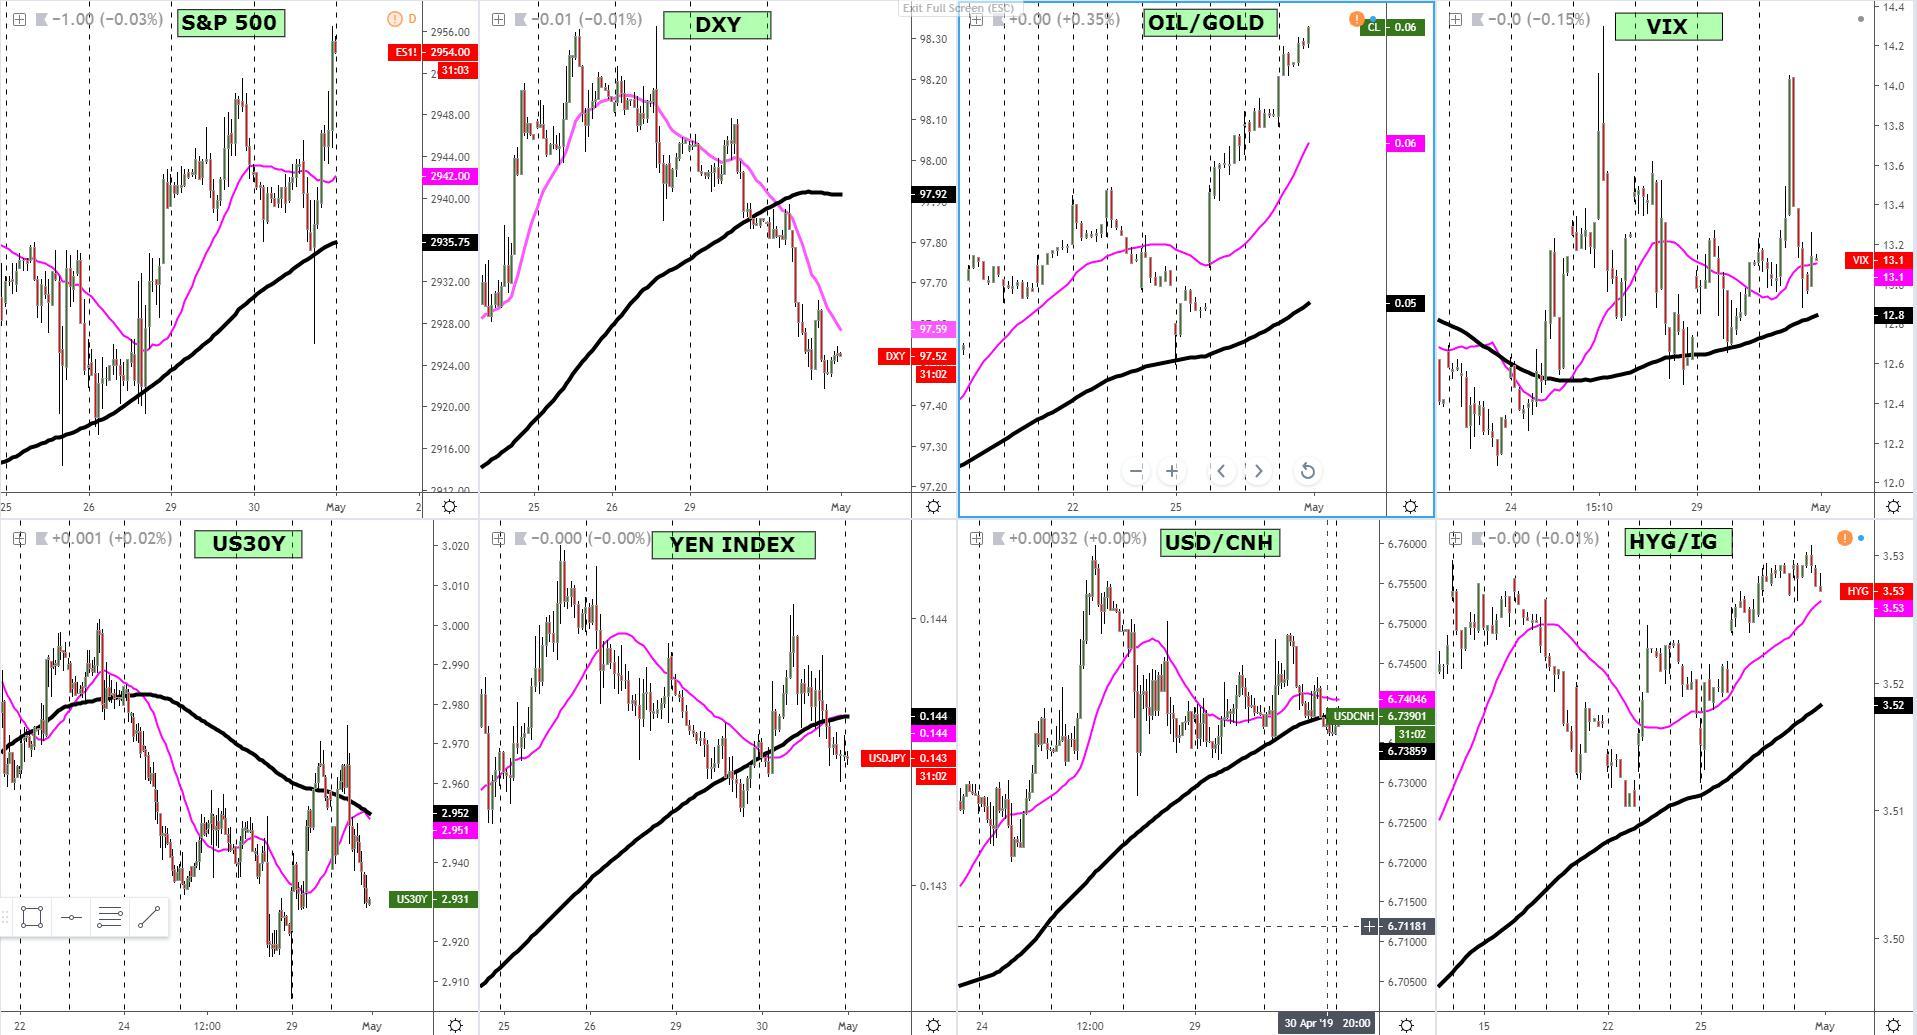
Tuesday’s environment qualifies as broad-based USD weakness as depicted by the drops in both the DXY but also in the US bond yields, where both micro slopes are back to negative territory. Even the macro slopes (125 HMA) are also aligning, despite we must be aware that the US data and the FOMC, will cause a reset and re-evaluation of market flows depending on the type of number and messages. The S&P 500, meanwhile, continues to advance at the rhythm of its own drummers, finding strong buying interest after a deep retracement which has allowed to achieve fresh all-time highs. It is precisely the combination of higher US stocks (S&P 500 as reference) and a weaker USD that has resulted in the risk-sensitive Japanese yen to go offered once again. The stability in the VIX, junk bonds, and the tight ranges recorded in the USD/CNH also act as a supporting factor for risk-seeking strategies to remain actively engaged. However, with main financial centers closed until the US, today’s moves will be very much dictated by fundamental-led learnings via the US ISM and the Fed, rather than taking much of a lead from the end of business in NY. A sensible strategy is to stay light in your positions until the usual pick up in vol during the London open, before a full-reassessment of the market permutations and whether or not the US data encourages the ‘risk on’ to prevail.
Latest Key Technical Developments In FX Majors
EUR/USD: Fundamentally-Driven Bullish Momentum
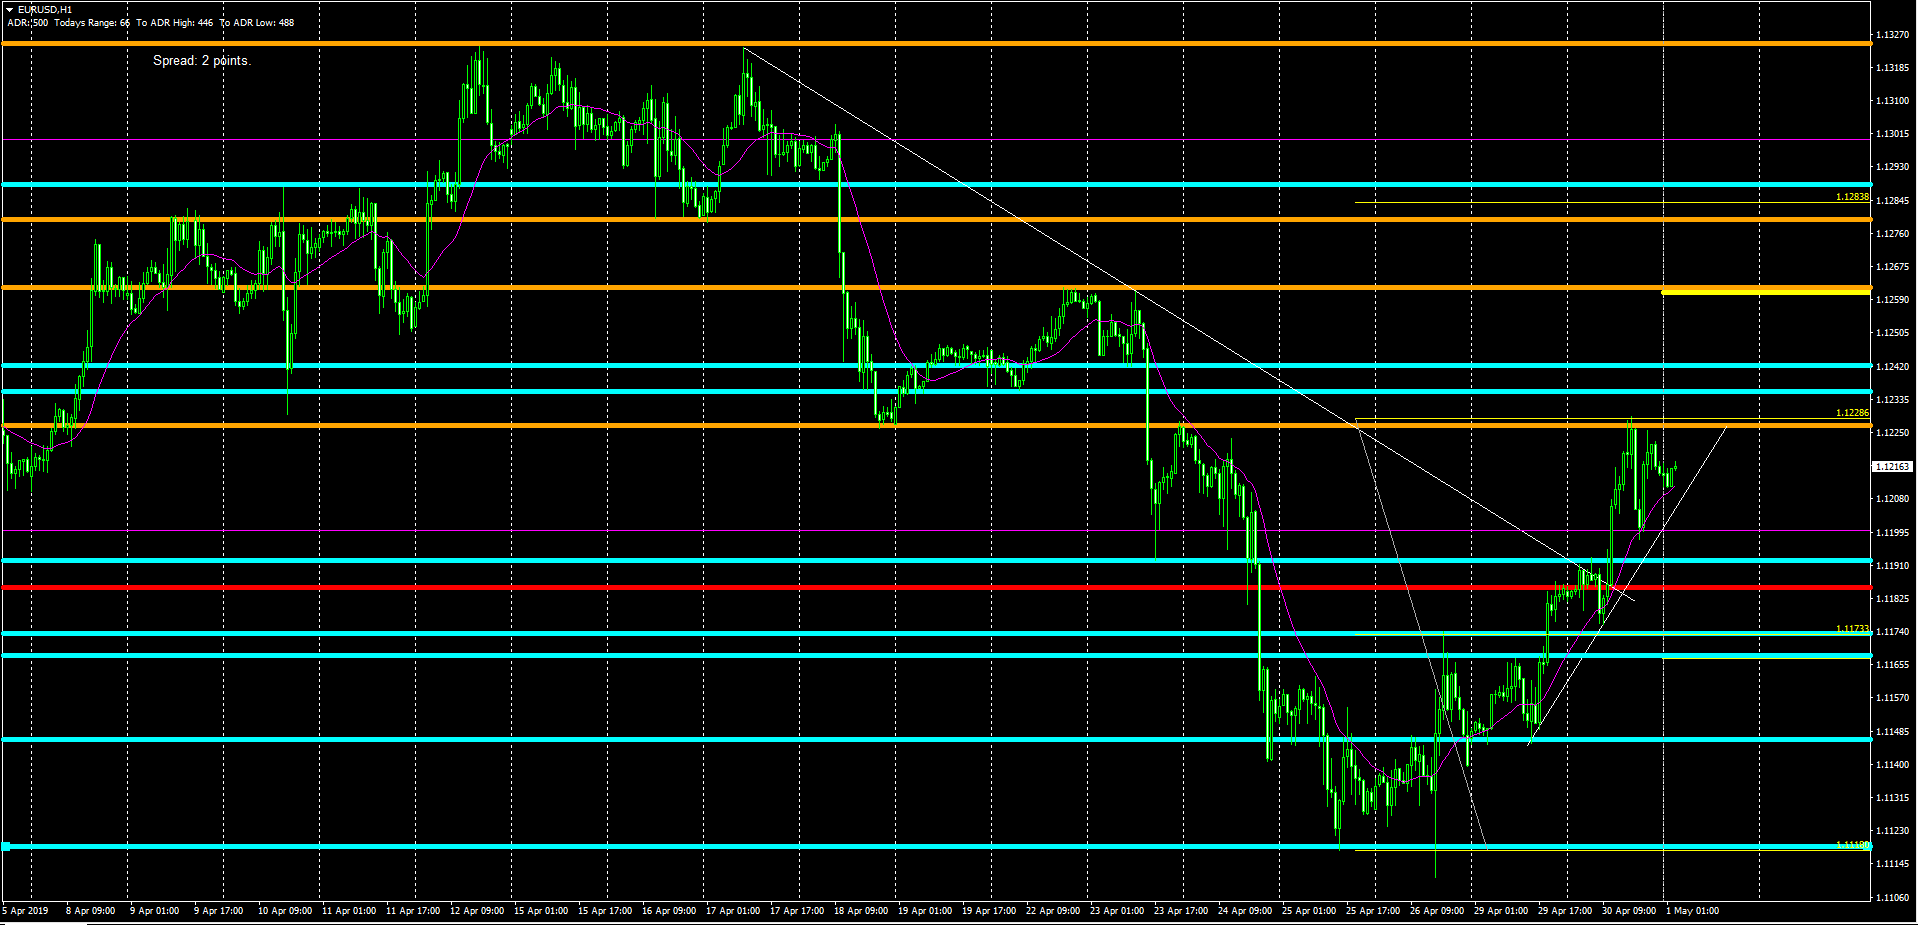
Improved European data has led to a resurgence of the EUR, this time able to exploit the deficit of USD demand on month-end flows and an overall constructive risk environment. The rally in the exchange rate has stopped on its tracks at a heavy offers cluster around 1.1225-30, which happens to align with the 100% projection level of the 1.1175 breakout measure as well as an H4 horizontal resistance. The bullish momentum, as reflected by the slope of the 25HMA, remains strong. The steepness of the newly created ascending trendline is yet another sign of the rampant movement, hence the retake of the trendline is a prerequisite to start seeing the first cracks in the trend.
GBP/USD: Sharpest Appreciation Since Early April
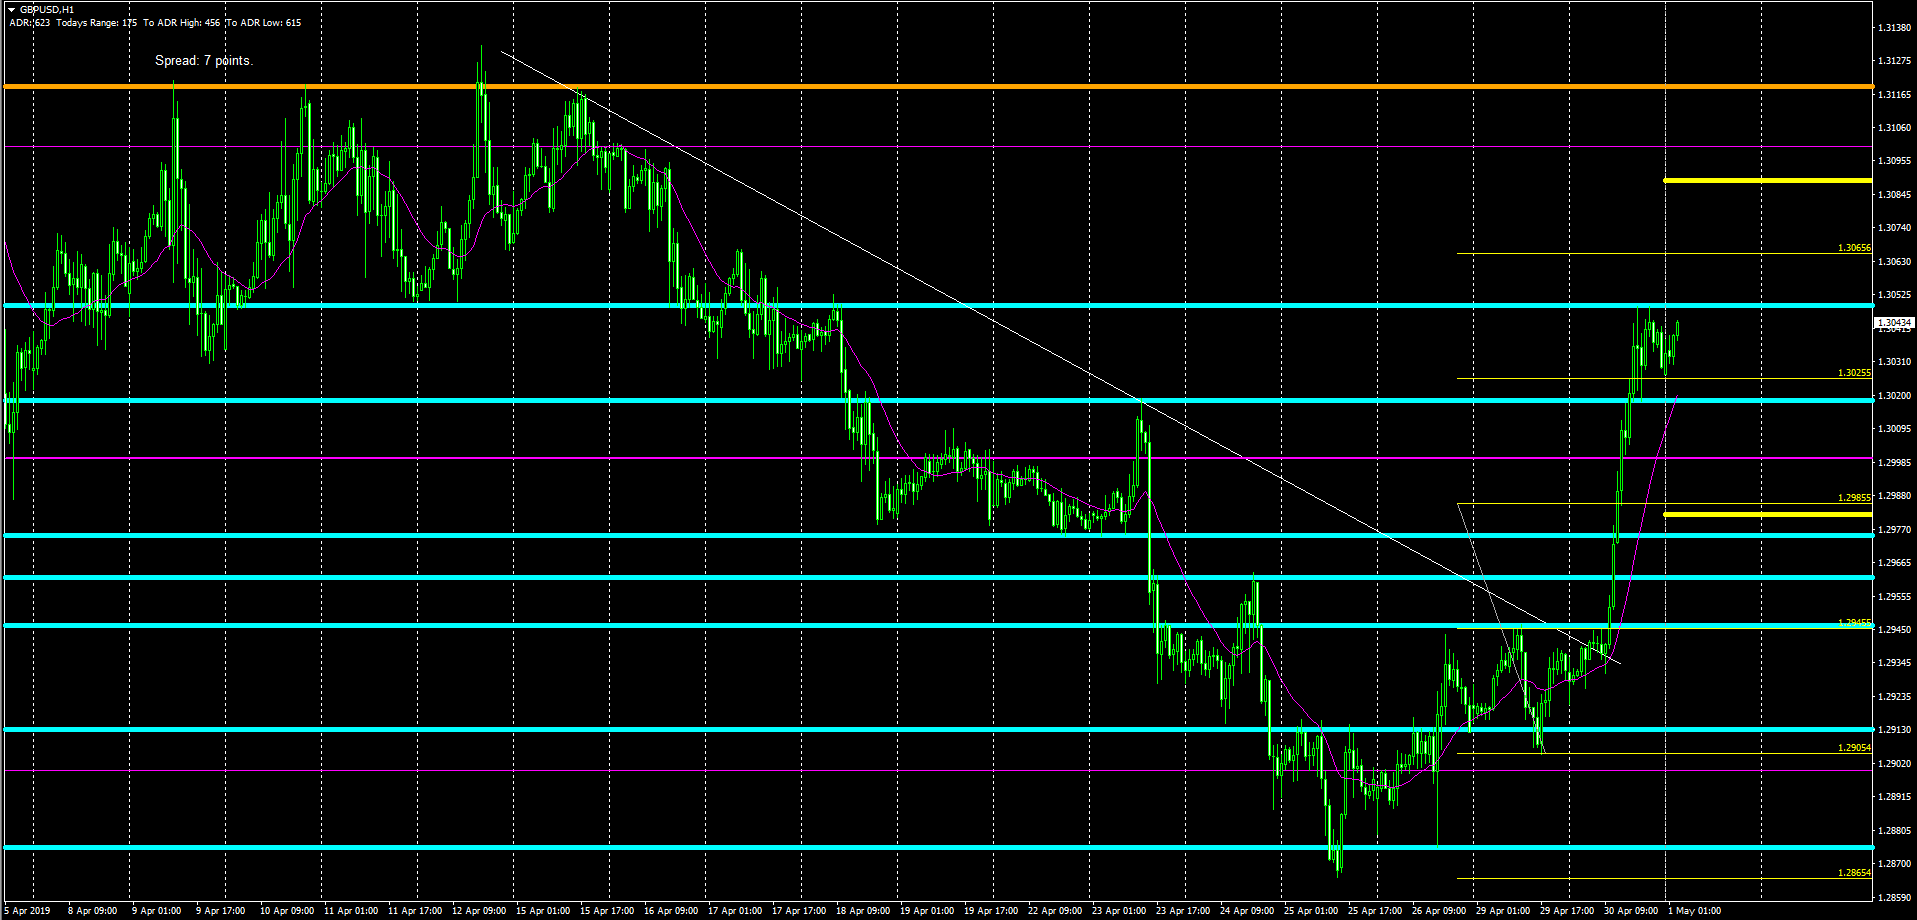
It’s certainly a rare occurrence to see the sterling or any currency for this matter to fly past not only the 100% projected target but even the 200% projected target with such ease, especially in these times of generally low volatility in FX. The slightly more constructive headlines over Brexit, where the Labour party and May’s government appear to be making progress, alongside a clear month-end rebalancing of FX flows in favor of the sterling and against the USD, have also aided the one-way street trend. At the bare minimum, given the extreme stretching of the rise in the exchange value, a potential period of consolidation between 1.3050 to the topside (horizontal resistance) and 1.3020-25 to the downside (200% projected target retest and former resistance) could develop. Should the USD regain its mojo, the round number at 1.30, ahead of 1.2985 (100% projected target retest) is where the next cluster of bids may be expected. What’s clear, after Tuesday’s price action, is that the main bias has now permuted to buy on weakness as part of a newly created first leg of a bullish cycle.
USD/JPY: Fresh Bearish Leg Established
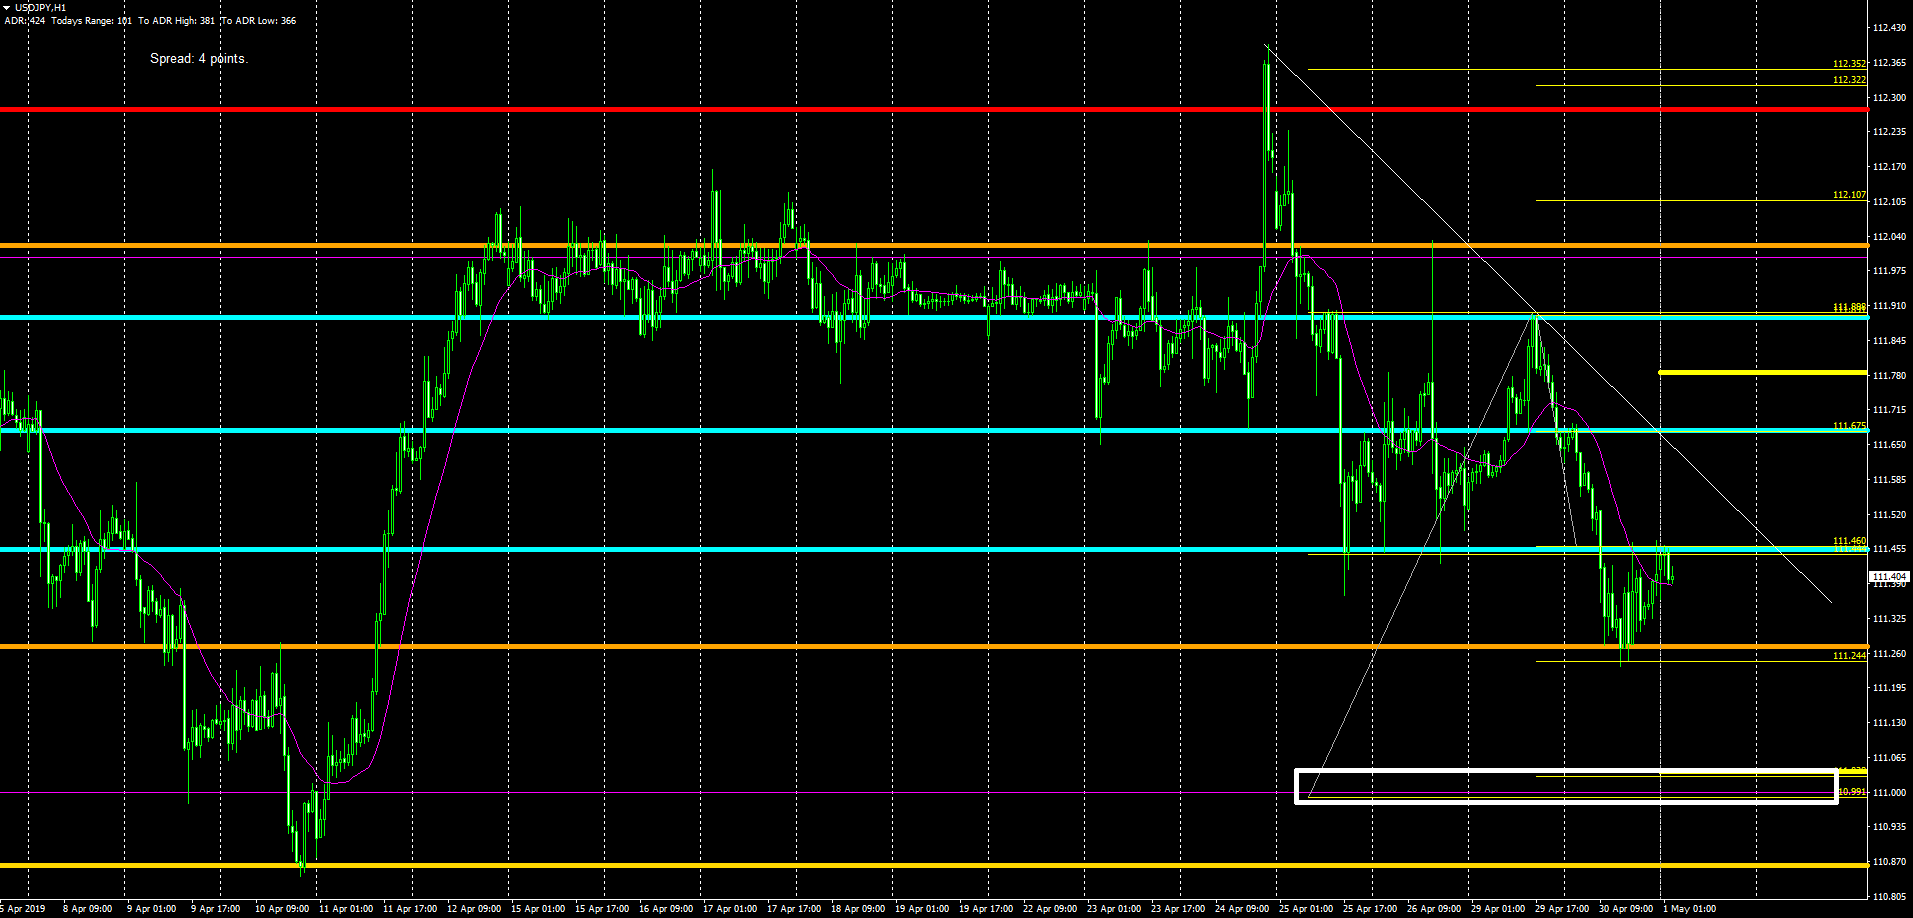
The story in this particular market is about the new low it found after the reversion back to buy yen on the back of the miss in China PMIs. As the day went on, and amid the recovery in the S&P 500 and the 200% projected target reached, buyers managed to create a mild rebound to retest the previous area of support-turned-resistance and the broken 100% projected target. The new leg lower in the pair allows us to draw a new trendline, which as usual, should serve as a visual aid of the evolving market bias. The weakness in both the DXY and the US30y has been a burden too heavy to bear for buyers, with players now waiting for the US ISM and the FOMC outcomes to determine the next directional bias. Looking at the next targets, any resumption of the downtrend should find an area rich in demand in the area highlighted in white, where two projected targets + round number intersect.
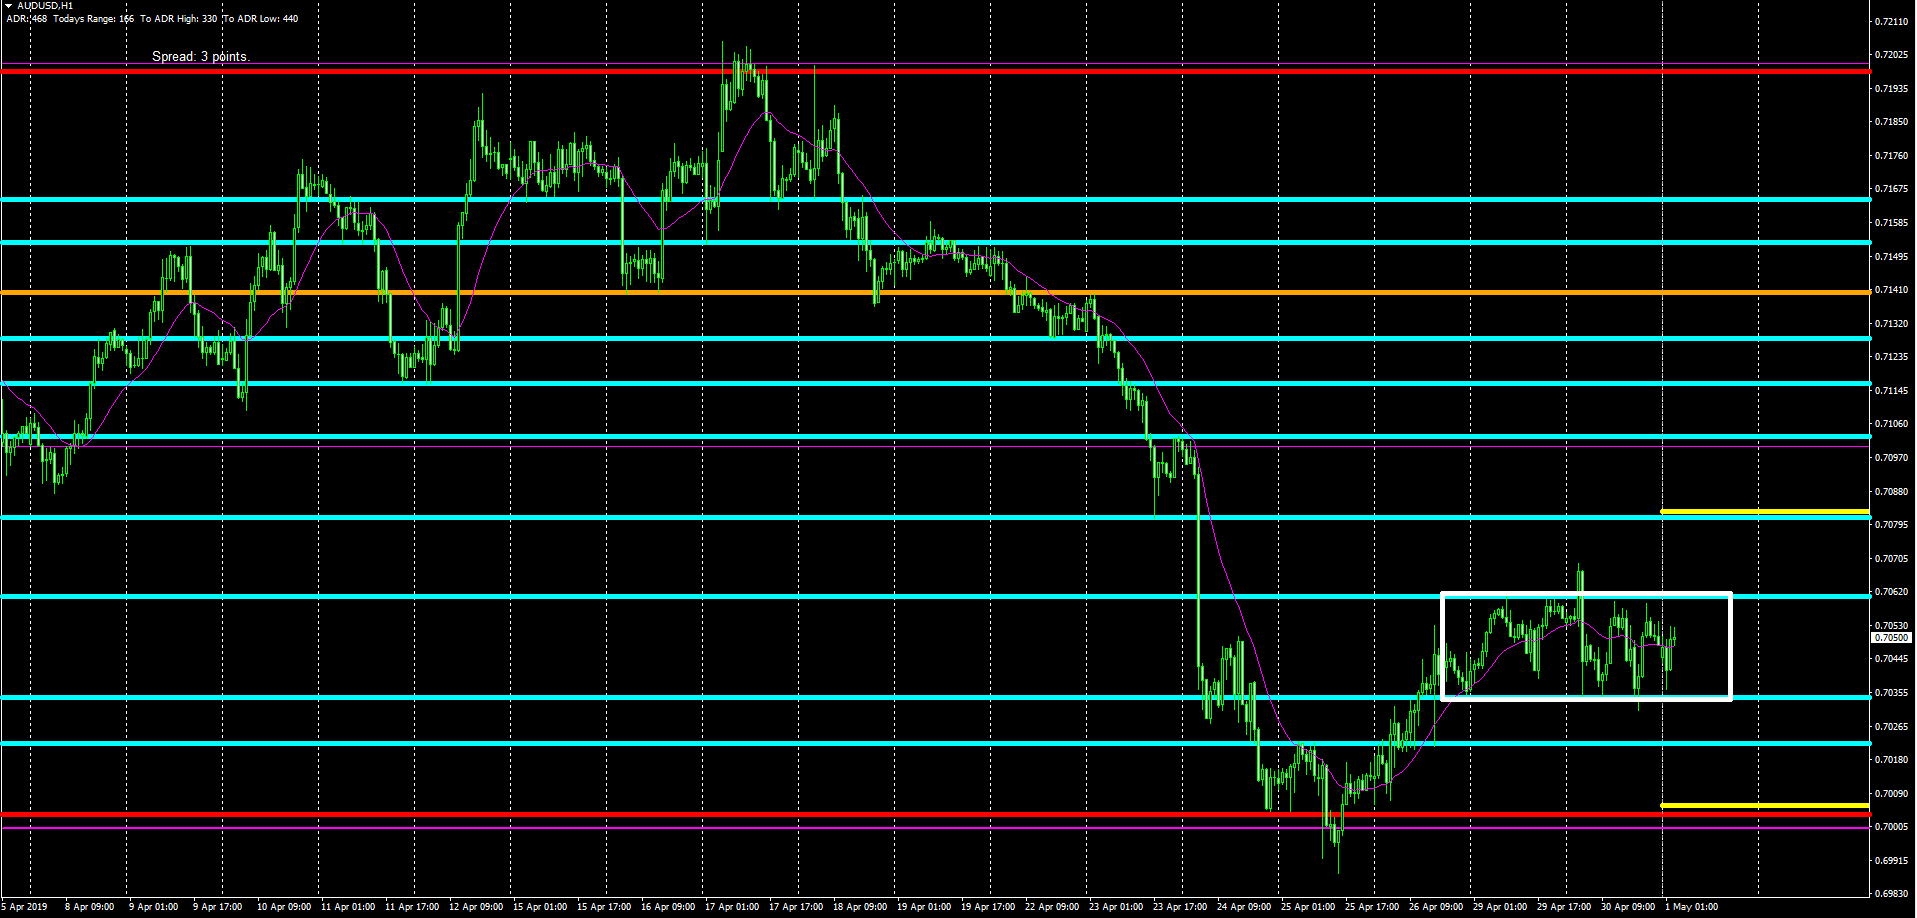
AUD/USD: Tight Range Post China PMIs
With no data releases of note until the US session, the Chinese market closed for public holidays, and the pair stuck in a tiny range worth 25 pips, the current conditions are clearly dominated by market makers, who act as liquidity providers in a sea of noise. Leveraged accounts, fast money, those with an interest to chase out directional movement, have 0 incentives to get involved in this market until a resolution of the consolidation, which will most likely transpire on the release of the US ISM data, followed by yet another re-evaluation of the price action as the FOMC releases its latest statement and Chairman Powell takes the stage to update the market on the latest set of policies. The Aussie has been clearly assisted to hold its range by broad-based USD weakness.
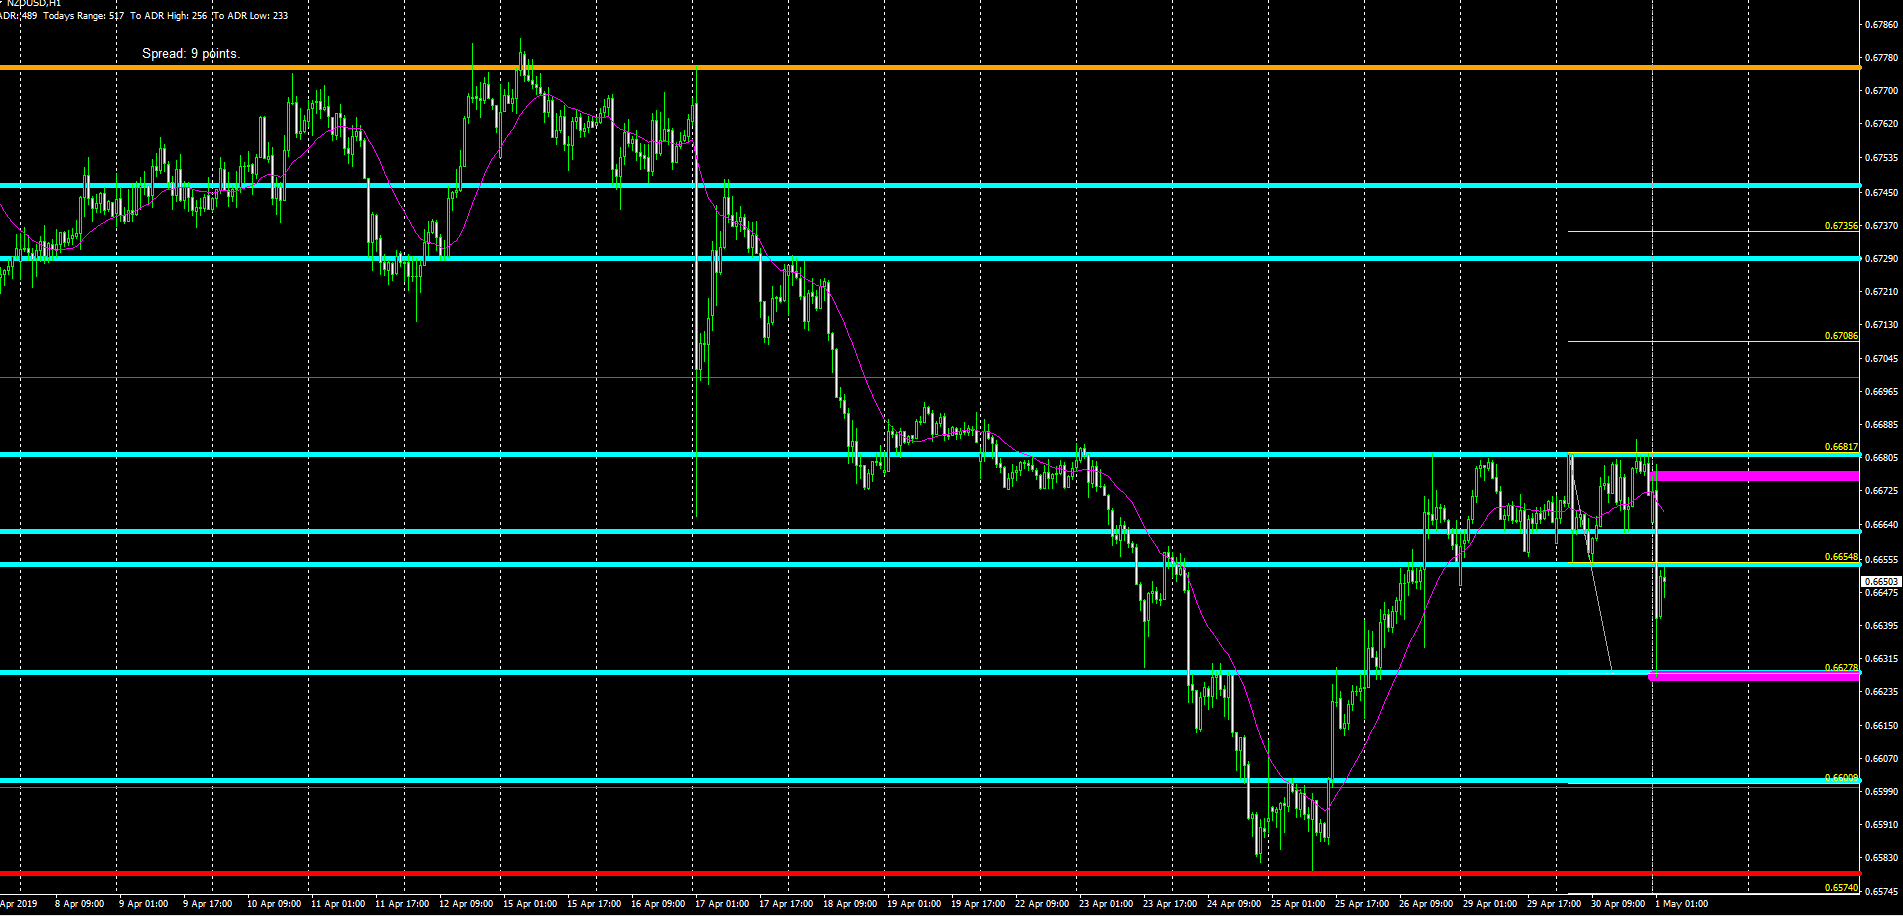
NZD/USD: Sold On NZ Jobs, Bought On Technicals
The play in the Asian session, in response to the downbeat NZ jobs headline number, has been to initially sell the Kiwi hard, only for the exchange rate to rebound at the anticipated cluster of bids circa 0.6625-30, where the 100% projected target, the ADR limit and the hourly horizontal support all met. Ever since the bottom found, the Kiwi has rebounded over 30p to now be retesting the former range bottom which should act as a solid area of resistance for the price to stall awaiting the next directional push once either London comes online or in response to the US ISM data.
Important Footnotes
- Risk model: The fact that financial markets have become so intertwined and dynamic makes it essential to stay constantly in tune with market conditions and adapt to new environments. This prop model will assist you to gauge the context that you are trading so that you can significantly reduce the downside risks. To understand the principles applied in the assessment of this model, refer to the tutorial How to Unpack Risk Sentiment Profiles
- Cycles: Markets evolve in cycles followed by a period of distribution and/or accumulation. The weekly cycles are highlighted in red, blue refers to the daily, while the black lines represent the hourly cycles. To understand the principles applied in the assessment of cycles, refer to the tutorial How To Read Market Structures In Forex
- POC: It refers to the point of control. It represents the areas of most interest by trading volume and should act as walls of bids/offers that may result in price reversals. The volume profile analysis tracks trading activity over a specified time period at specified price levels. The study reveals the constant evolution of the market auction process. If you wish to find out more about the importance of the POC, refer to the tutorial How to Read Volume Profile Structures
- Tick Volume: Price updates activity provides great insights into the actual buy or sell-side commitment to be engaged into a specific directional movement. Studies validate that price updates (tick volume) are highly correlated to actual traded volume, with the correlation being very high, when looking at hourly data. If you wish to find out more about the importance tick volume, refer to the tutorial on Why Is Tick Volume Important To Monitor?
- Horizontal Support/Resistance: Unlike levels of dynamic support or resistance or more subjective measurements such as fibonacci retracements, pivot points, trendlines, or other forms of reactive areas, the horizontal lines of support and resistance are universal concepts used by the majority of market participants. It, therefore, makes the areas the most widely followed and relevant to monitor. The Ultimate Guide To Identify Areas Of High Interest In Any Market
- Trendlines: Besides the horizontal lines, trendlines are helpful as a visual representation of the trend. The trendlines are drawn respecting a series of rules that determine the validation of a new cycle being created. Therefore, these trendline drawn in the chart hinge to a certain interpretation of market structures.
- Correlations: Each forex pair has a series of highly correlated assets to assess valuations. This type of study is called inter-market analysis and it involves scoping out anomalies in the ever-evolving global interconnectivity between equities, bonds, currencies, and commodities. If you would like to understand more about this concept, refer to the tutorial How Divergence In Correlated Assets Can Help You Add An Edge.
- Fundamentals: It’s important to highlight that the daily market outlook provided in this report is subject to the impact of the fundamental news. Any unexpected news may cause the price to behave erratically in the short term.
- Projection Targets: The usefulness of the 100% projection resides in the symmetry and harmonic relationships of market cycles. By drawing a 100% projection, you can anticipate the area in the chart where some type of pause and potential reversals in price is likely to occur, due to 1. The side in control of the cycle takes profits 2. Counter-trend positions are added by contrarian players 3. These are price points where limit orders are set by market-makers. You can find out more by reading the tutorial on The Magical 100% Fibonacci Projection

