U.S. Markets Sell-Off Across The Board, Large Caps Hurt Most

Published 03/11/2015, 05:18 AM
Updated 07/09/2023, 06:31 AM
US500
-
US2000
-
IXIC
-
SOX
-

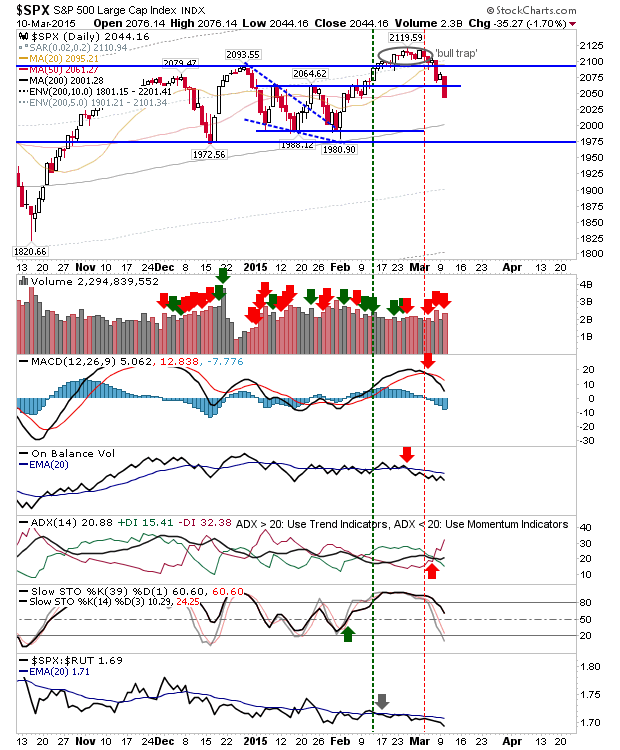
Yesterday was a tough day for bulls, a day which hurt Large Caps more than any other index. The S&P 500 cut deep below 2064. It looks good for a push back to the 200-day MA, which is just above 1,988 support. Volume climbed to register as distribution.
SPX Daily Chart


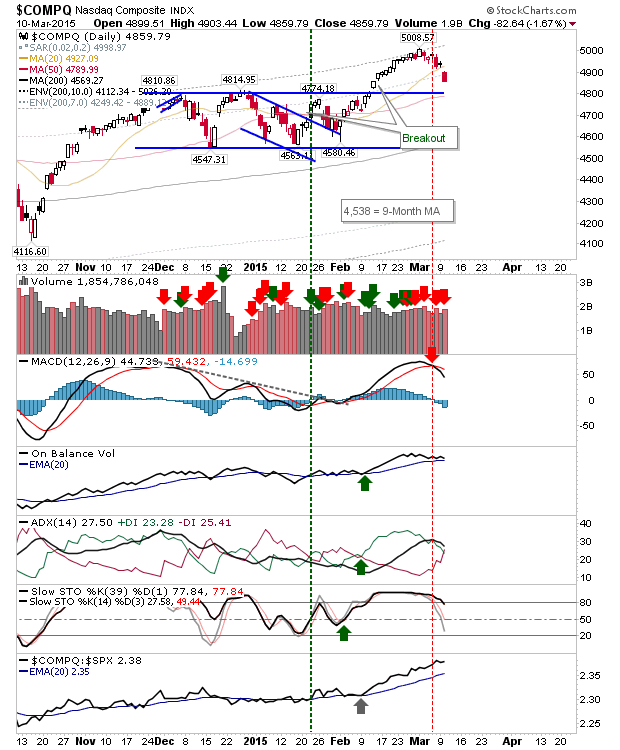
The NASDAQ still has support to work against, and room to maintain bullish momentum with the 50-day MA near 4810 support. Volume climbed to register distribution, but this is not too damaging at current levels.
NASDAQ Daily Chart


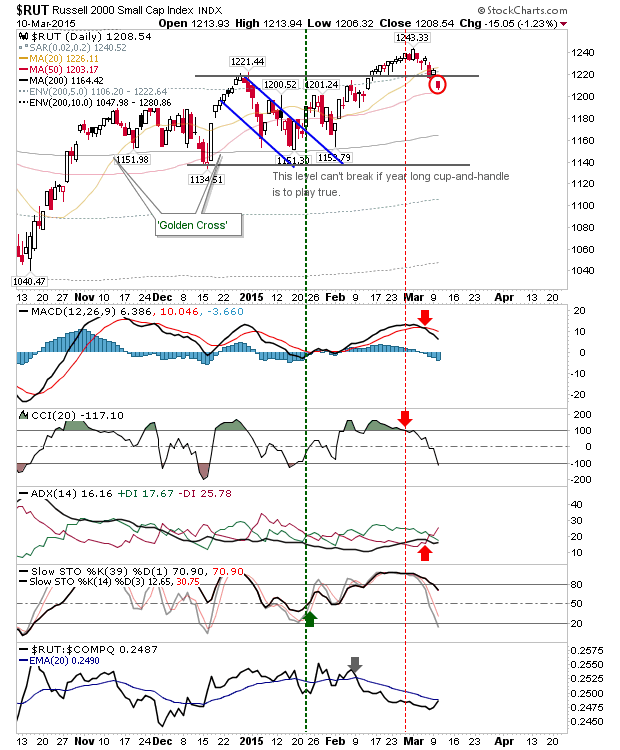
The Russell 2000 was caught in the middle. As the index most needed to have a strong 2015 (after a lackluster 2014), it has fallen back inside its prior base. Bulls can recover if there is a quick rally above 1220, as this would create a 'bear trap'. But should it drift lower, then an undercut of 1,134 is more likely; a loss of the 50-day MA would confirm.
RUT Daily Chart


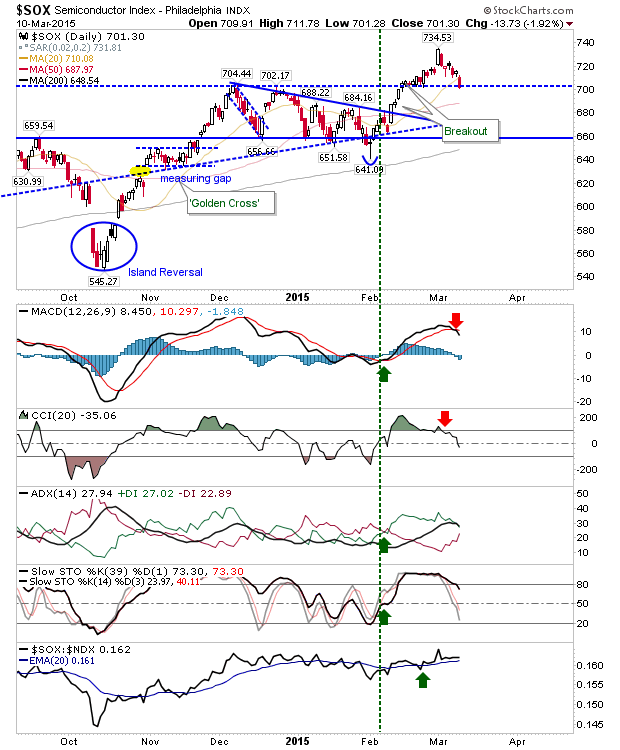
The Semiconductor Index was under similar pressure as the Russell 2000. However, it's clinging on to support, which gives bulls something to work with today.
SOX Daily Chart


For today early gains set up the potential for a 'bear trap' in the Russell 2000 and a workable bounce in the Semiconductor Index. If there are opening losses, then the NASDAQ has room to run before it reaches support.

Latest comments

Loading next article…
Risk Disclosure: Trading in financial instruments and/or cryptocurrencies involves high risks including the risk of losing some, or all, of your investment amount, and may not be suitable for all investors. Prices of cryptocurrencies are extremely volatile and may be affected by external factors such as financial, regulatory or political events. Trading on margin increases the financial risks.
Before deciding to trade in financial instrument or cryptocurrencies you should be fully informed of the risks and costs associated with trading the financial markets, carefully consider your investment objectives, level of experience, and risk appetite, and seek professional advice where needed.
Fusion Media would like to remind you that the data contained in this website is not necessarily real-time nor accurate. The data and prices on the website are not necessarily provided by any market or exchange, but may be provided by market makers, and so prices may not be accurate and may differ from the actual price at any given market, meaning prices are indicative and not appropriate for trading purposes. Fusion Media and any provider of the data contained in this website will not accept liability for any loss or damage as a result of your trading, or your reliance on the information contained within this website.
It is prohibited to use, store, reproduce, display, modify, transmit or distribute the data contained in this website without the explicit prior written permission of Fusion Media and/or the data provider. All intellectual property rights are reserved by the providers and/or the exchange providing the data contained in this website.
Fusion Media may be compensated by the advertisers that appear on the website, based on your interaction with the advertisements or advertisers.
© 2007-2025 - Fusion Media Limited. All Rights Reserved.