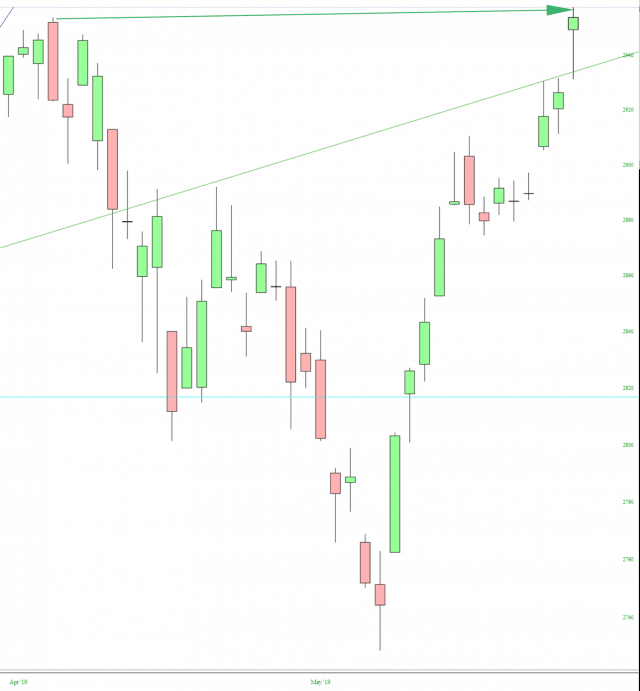
Ever since June 3rd, equities have been going straight up. The icing on the proverbial bull cake happened on Thursday when the S&P 500 made a new lifetime high, both on an intraday basis as well as a closing basis. It was only a tiny bit higher than the higher set a couple months ago, but it was the highest point in human history nonetheless.
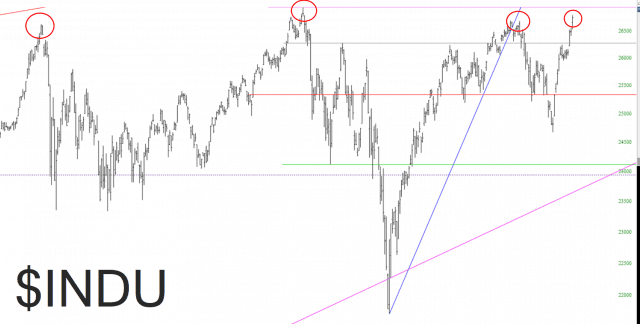
It’s all up to the G-20 at this point. If the U.S. and China announce some kind of awesome trade deal, the markets are just going to keep rocketing higher, and 3,000 on the SPX will be swiftly surpassed. If there is no deal or, worse, acrimony, then the market will do what it has done three times already, and simply roll away from the general zone I’ve circled below.
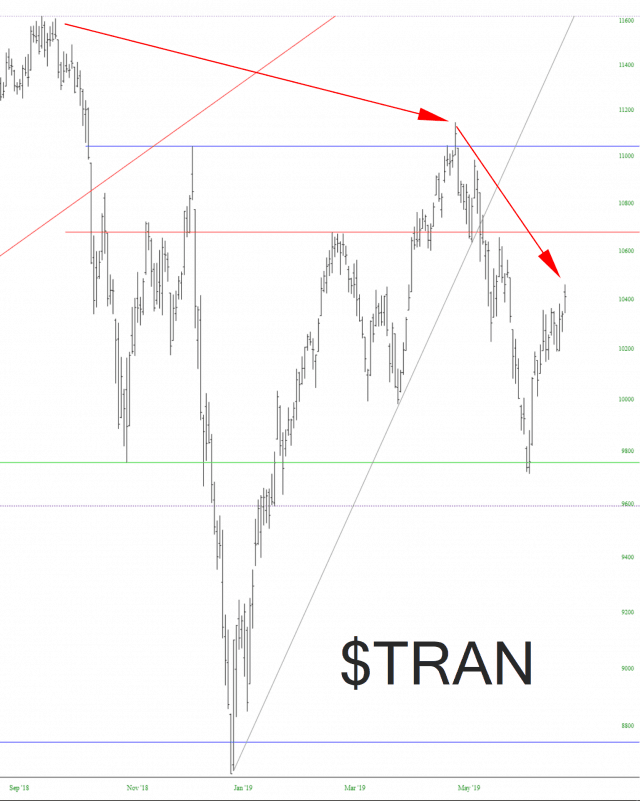
Far weaker than the likes of the Dow 30 and the S&P is the Dow Jones Transportation Index. I’m already short AAL and UAL, and if this is the best the TRAN can do under these insanely favorable circumstances, I’d say it’s in a world of hurt.
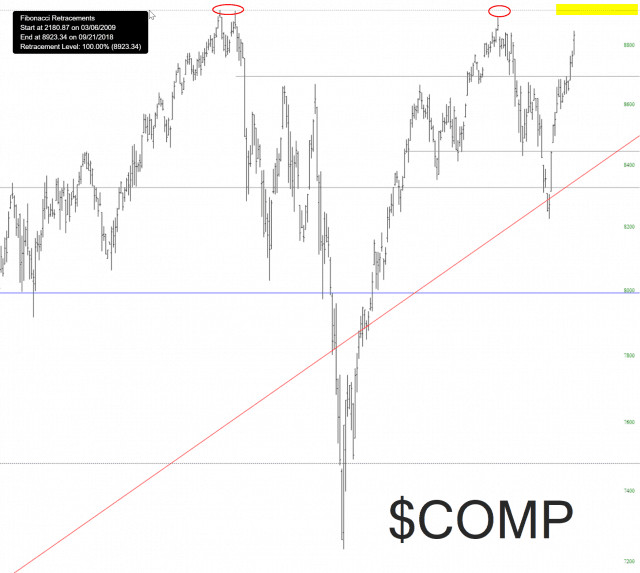
Although the Industrials are strong and the Transports are relatively weak, what’s picking up the slack is the Utilities, which themselves hit a lifetime high. Smash them all together, and you get the Dow Jones Composite, which is approaching its own lifetime high. Keep in mind those two circled areas, however. That seems to be some kind of exhaustion point.
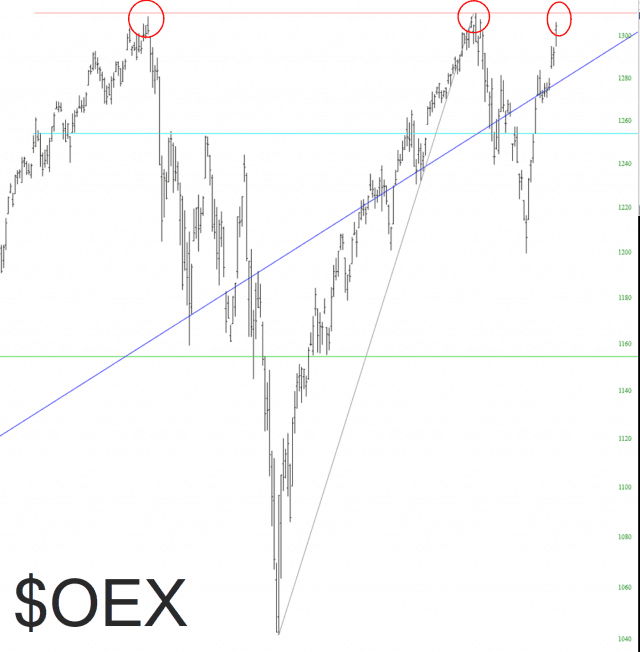
The same can be said for the S&P 100. Three times in a row, we have approached the red horizontal I’ve drawn. The only thing it has meant in prior instances was that it was time for bulls to take profits and run away as fast as possible. A break above this line would just add another chapter to the Bullish Book, however, now eleven years running.
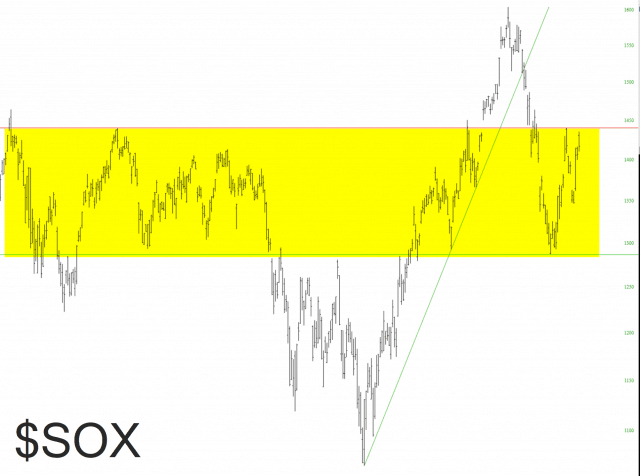
Another area of potential exhaustion is the semiconductor sector, which was a major focus of the China trade war chatter. we’re once again at the high end of the range I’ve tinted, having bounced strongly from the June 3rd low.
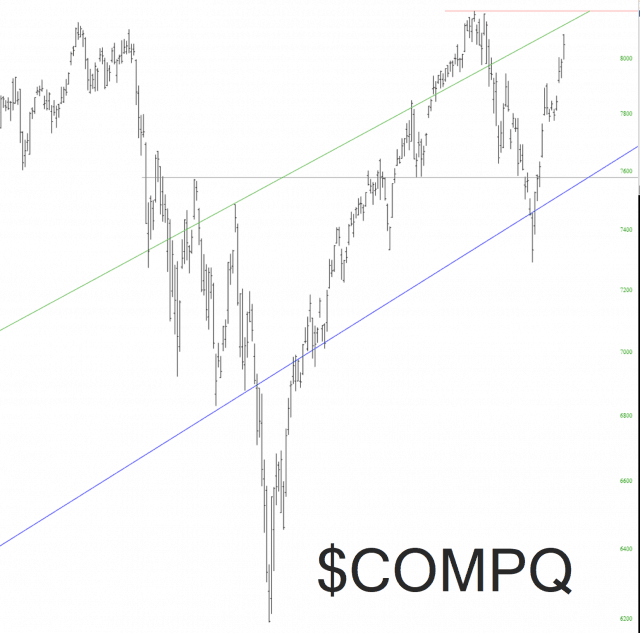
With semiconductors well off their lifetime highs, the NASDAQ Composite hasn’t quite mustered the achievement that the S&P 500 did. I’ve marked the lifetime high, also accomplished two months ago, with a red horizontal line. We haven’t crossed it yet, but we’re close.
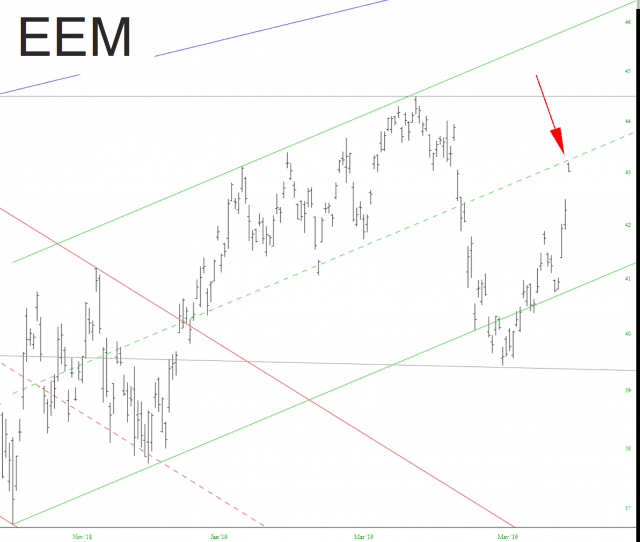
Jumping overseas, the emerging markets fund has been terrifically chart-friendly. I had pointed out the midline of its price channel, and as you can see, we tagged that midline almost to the pixel. The easy bounce is over.
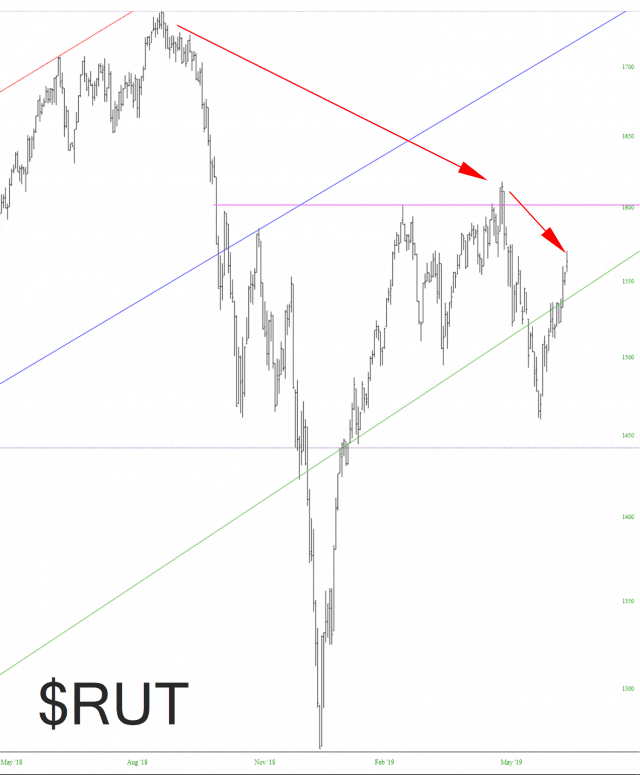
Finally, I would say the sector that remains must vulnerable to a resumption of weakness is the small caps, represented here via the Russell 2000 cash index. Even with furious bullish gales blowing into the sails of the longs, the small caps market has been feeble. Yes, there were lifetime highs in some indexes, but for the Russell, those highs remain miles away.

