
Following Monday’s rebound, equities traded mixed on Tuesday and during the Asian morning Wednesday, perhaps as investors decided to lock some profits ahead of the FOMC decision later today. Apart from the FOMC decision, market participants will also keep an eye on the debate in the US Congress over a new coronavirus-aid bill. As we get closer to the expiration of the enhanced unemployment benefits, investors will be more eager to find out whether a common ground could be reached beforehand.
INVESTORS LOCK GAZE ON FOMC AND US CONGRESS DECISIONS
The dollar traded lower against the majority of the other G10 currencies. It underperformed the most against GBP, JPY, CHF, and AUD in that order, while it eked out some gains only against SEK. The greenback was found virtually unchanged versus CAD and NZD.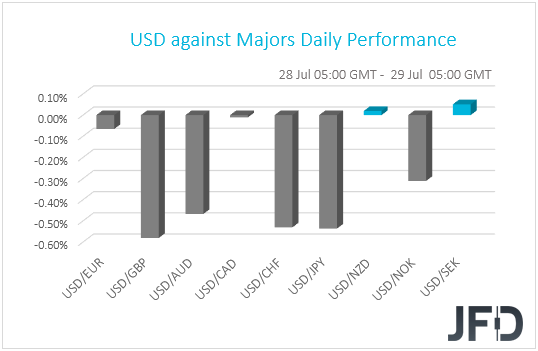
The strengthening of the safe-havens yen and franc suggests that markets traded in a risk-off fashion yesterday. Nevertheless, the dollar traded on the back foot, while the Aussie was among the main gainers, which point otherwise. Thus, we prefer to turn our gaze to the equity world in order to get a better picture with regards to the broader investor morale. Having said that though, there things were not that clearer. EU bourses ended their Tuesday session mixed, and while the US indices slid on average 0.90%, the Asian ones were also on the mixed side. Japan’s Nikkei 225 lost 1.18%, but at the time of writing, China’s Shanghai is up 1.51%, while Hong Kong’s Hang Seng is found virtually unchanged.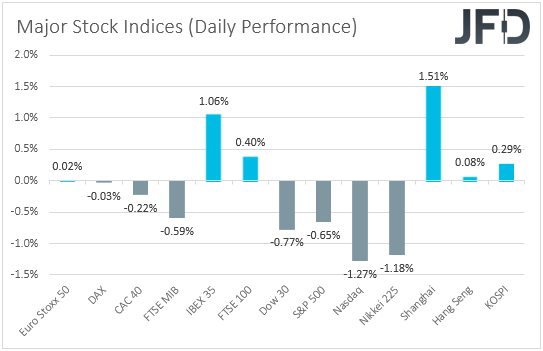
Following the rebound in equities during the US session Monday and the Asian trading Tuesday, it seems that investors decided to lock some profits ahead of the FOMC decision today. The fact that the US Congress has yet to find common ground on a new coronavirus-aid bill may have also weighed somewhat on equities.
Kicking off with the FOMC, at its latest meeting, the Committee kept interest rates unchanged and noted that they will continue to increase purchases of bonds and mortgage-backed securities “at least at the current pace”, something suggesting that purchases can accelerate if deemed necessary. With regards to the dot plot, the median dots suggested that interest rates are likely to stay at the current level at least until 2022. “We're not thinking about raising rates, we're not even thinking about thinking about raising rates”, Fed Chair Powell characteristically said at the press conference following the decision.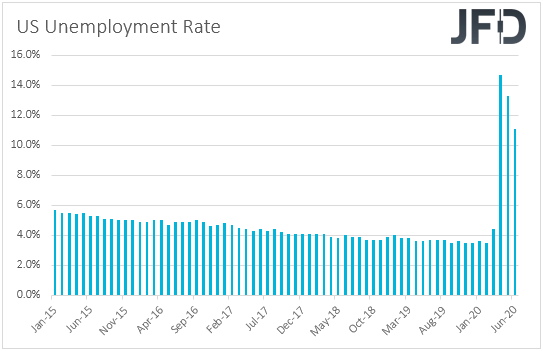
Since then, data were somewhat encouraging, with the unemployment rate declining for the second straight month in June, the NFPs revealing record gains, and the ISM PMIs for the month returning into expansionary territory. However, with the virus still spreading fast in the US, several states have halted or reversed their reopening, which could dampen the economic recovery and raise speculation over more stimulus. Thus, although policymakers are not expected to act this time around, investors may look for hints as to how ready they are to act again if the situation continues to worsen. In other words, it would be interesting to see whether they will maintain the “at least at the current pace” wording and whether they will strengthen it. On top of that, market chatter suggests that Chief Powell may be asked whether members have discussed the possibility of a yield-curve control.
A dovish message including stronger guidance that more stimulus could be proposed soon, and an open door to yield-curve control, may allow equities to rebound again, as this would mean that the Fed will battle the pandemic and try to prevent another economic downturn by all means necessary. As far as the dollar is concerned, due to its safe-haven status, it may come under selling interest in such a case, especially against risk-linked currencies, like the Aussie and the Kiwi, as well as against the euro, which has been on a rally mode recently, due to the agreement between EU leaders last Tuesday on a coronavirus rescue fund.
That said, for any potential rebound to be sustained, members of the US Congress may need to find common ground on a new coronavirus-aid bill before Friday, when the enhanced unemployment benefits expire. As we already noted yesterday, the Republicans proposed a USD 1trl plan, but the Democrats see that proposal as not sufficient and instead suggest a USD 3trl bill. In our view, for equities to stay supported, any agreed plan has to be as close as possible to Democrats’ proposal. Anything near the 1trl, or even lower, may come as a disappointment. Republicans’ plan is not considered insufficient only by Democrats, but also by many market participants.
DJIA – TECHNICAL OUTLOOK
The Dow Jones Industrial Average cash index has been trading on a sliding mode since yesterday when it hit resistance at the 26710 barrier. Today, the cash index moved below Monday’s low of 26345, but overall, it stays above the tentative upside support line drawn from the low of June 15th. Thus, despite the possibility of some further retreat, as long as the price continues to trade above that line, we would consider the near-term outlook to be somewhat positive.
The current slide may continue until the index tests the aforementioned upside line or the 26030 zone, which provided strong support on July 13th and 14th. The bulls may take charge from near that crossroads and perhaps drive the battle back up to yesterday’s high of 26710. If they are strong enough to overcome that hurdle this time around, we may then see them pushing towards the high of July 23rd, at 27165.
On the downside, we would like to see a decisive dip back below 25790 before we start examining whether the outlook has turned to a negative one. The index would already be below the tentative upside support line, and thus, the bears may get encouraged to dive towards the low of July 10th, at 25425. Another dip, below 25425, may extend the slide towards the 25135 areal, marked as a support by the low of June 25th.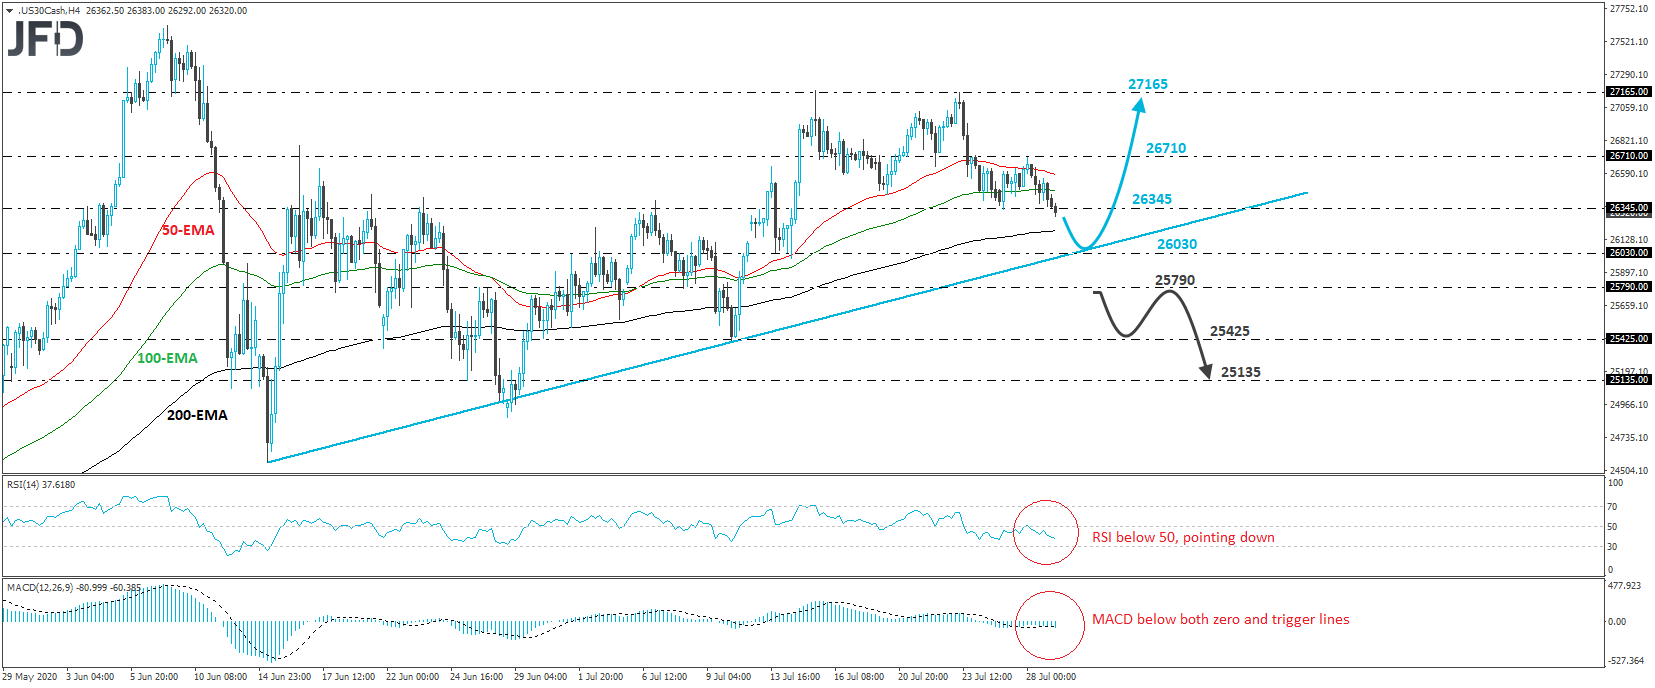
EUR/USD – TECHNICAL OUTLOOK
EUR/USD traded lower yesterday, after hitting resistance at 1.1780 on Monday. That said, the slide was stopped near the 1.1700 line. Overall, the pair is trading above the upside support line drawn from the low of May 14th, as well as above a shorter-term, steeper one, taken from the low of July 10th. Combined with the fact that the rate is also trading above all three of our moving averages on the 4-hour chart, this pains a positive short-term picture, despite yesterday’s retreat.
Thus, we would expect the bulls to take charge again at some point soon and perhaps aim for another test near the 1.1780 area. They may allow another pullback after testing that zone, but as long as the rate would stay above the steep upside line drawn from the low of July 10th, we would see decent chances for another push higher. If the 1.1780 zone eventually surrenders, we may see the bulls aiming for the 1.1815 level, marked by the high of September 24th, 2018, the break of which may extend the rally towards the high of June 14th, 2018, at around 1.1855.
On the downside, a dip below the 1.1625 barrier and the upside line taken from the low of July 10th, may pave the way for a larger negative correction. The bears may initially aim for the 1.1560 zone, the break of which may set the stage for declines towards the low of July 22nd, at around 1.1505. Slightly lower runs the upside line drawn from the low of May 14th, which could provide additional support.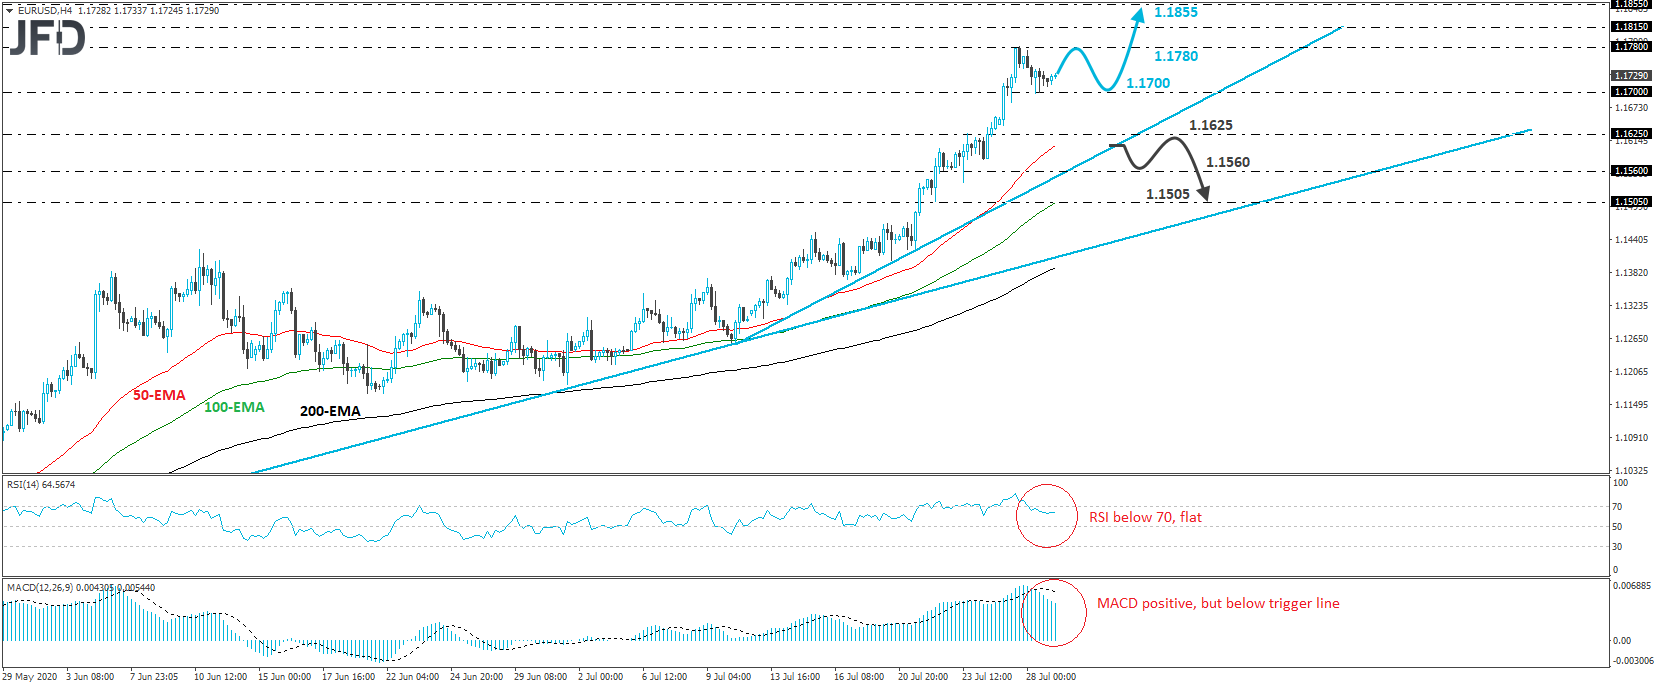
AS FOR THE REST OF TODAY’S EVENTS
Apart from the FOMC decision, the only other events on the calendar worth mentioning are the US pending home sales for June, and the EIA (Energy Information Administration) weekly report on crude oil inventories for last week. Pending home sales are forecast to have slowed to +15.0% mom from +44.3%, which is still a strong reading compared to the ones we were getting in the pre-coronavirus era. With regards to the EIA report, expectations are for a 0.267mn inventory slide after a 1.073mn build the week before. However, bearing in mind that the API (American Petroleum Institute) report revealed a 6.829mn slide, we would consider the risks surrounding the EIA forecast as tilted to the downside.
Tonight, during the Asian morning Thursday, we have New Zealand’s ANZ business confidence index for July, but no forecast is currently available.