The S&P 500 closed Wednesday down 2.6%, while DJI lost 2%, which predetermined the markets' negative sentiment on Thursday morning, taking away 1.8% from the MSCI's broadest index of Asia-Pacific.
The sharp sentiment reversal was illustrated by Apple (NASDAQ:AAPL)'s performance, losing more than 3% despite a better than expected quarterly report. While the attention of journalists and traders is focused on the success of communities on Reddit as they battle hedge funds for GameStop (NYSE:GME), AMC and Nokia (NYSE:NOK) with multiple enormous intraday rises, the markets as a whole have shifted into a broad sell-off.
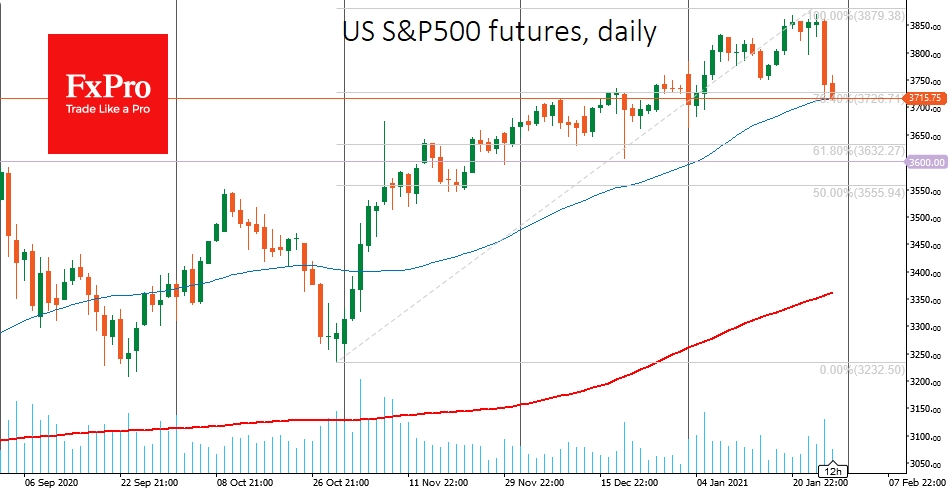
The S&P500 index is testing support in the form of the 50-day average at 3700. The index's ability to hold above this line could attract buyers on the dip in the days ahead. A further decline would open the way for a deeper correction to 3600 or even to the 3400 area, where the 200-day moving average passes.
The sell-off in the markets intensified after the Fed meeting, reaching an alarming scale at the close of trading and indicating a predominance of selling among institutionalists. The tendency to take profits from the rally in the previous months can be attributed to the Fed's unchanged stance.
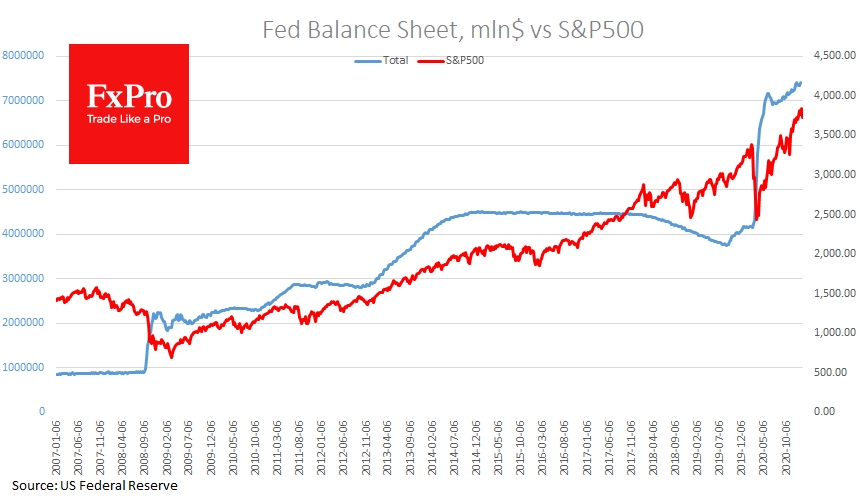
Financing relief programmes will draw liquidity out of the market. Last year, enormous capital in markets was balanced by the first and biggest Fed QE phase. Yesterday, however, Powell made it clear that the Fed will continue the $120bn/month buying programme for now, with $80bn for US Treasuries.
This is bad news for the stock market, as some of the money promises to move into US government bonds in the short term. In such an environment, it will be more difficult for assets to grow.
The currency market seems to have crossed the Rubicon, and struck the 50 SMAs, at least in EUR/USD and USD/JPY. This could also be a trend reversal signal for the stock market.
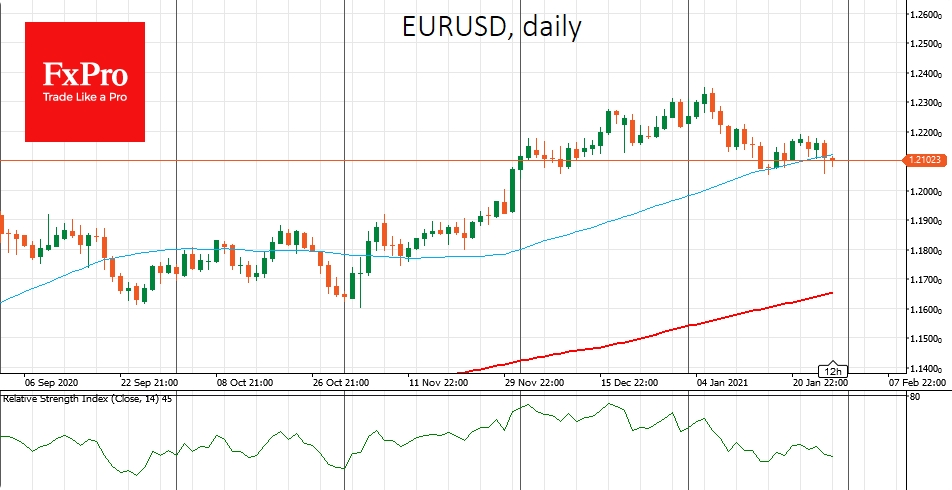
EUR/USD fell to 1.21, breaking the support of the 50-DMA and going to the area of 2-month lows. Comments from ECB officials supported the downward momentum in EUR. They noted that there are weapons in the arsenal to pressure the euro exchange rate and that markets are underpricing the central bank's readiness to cut the rates.
ECB easing is positive for European stocks, which may perform better than many other markets on rate cuts and QE expansion. However, it is also a negative for currency pairs with the euro, which can kick-start a more profound correction after the single currency's rise last year. A break below 1.2050 has the potential to open a direct path into the 1.1900-1.1950 area.
The FxPro Analyst Team
- English (UK)
- English (India)
- English (Canada)
- English (Australia)
- English (South Africa)
- English (Philippines)
- English (Nigeria)
- Deutsch
- Español (España)
- Español (México)
- Français
- Italiano
- Nederlands
- Português (Portugal)
- Polski
- Português (Brasil)
- Русский
- Türkçe
- العربية
- Ελληνικά
- Svenska
- Suomi
- עברית
- 日本語
- 한국어
- 简体中文
- 繁體中文
- Bahasa Indonesia
- Bahasa Melayu
- ไทย
- Tiếng Việt
- हिंदी
EUR/USD Crosses Rubicon, S&P 500 Clinging To Support
Published 01/28/2021, 06:13 AM
Updated 03/21/2024, 07:45 AM
EUR/USD Crosses Rubicon, S&P 500 Clinging To Support
Latest comments
Loading next article…
Install Our App
Risk Disclosure: Trading in financial instruments and/or cryptocurrencies involves high risks including the risk of losing some, or all, of your investment amount, and may not be suitable for all investors. Prices of cryptocurrencies are extremely volatile and may be affected by external factors such as financial, regulatory or political events. Trading on margin increases the financial risks.
Before deciding to trade in financial instrument or cryptocurrencies you should be fully informed of the risks and costs associated with trading the financial markets, carefully consider your investment objectives, level of experience, and risk appetite, and seek professional advice where needed.
Fusion Media would like to remind you that the data contained in this website is not necessarily real-time nor accurate. The data and prices on the website are not necessarily provided by any market or exchange, but may be provided by market makers, and so prices may not be accurate and may differ from the actual price at any given market, meaning prices are indicative and not appropriate for trading purposes. Fusion Media and any provider of the data contained in this website will not accept liability for any loss or damage as a result of your trading, or your reliance on the information contained within this website.
It is prohibited to use, store, reproduce, display, modify, transmit or distribute the data contained in this website without the explicit prior written permission of Fusion Media and/or the data provider. All intellectual property rights are reserved by the providers and/or the exchange providing the data contained in this website.
Fusion Media may be compensated by the advertisers that appear on the website, based on your interaction with the advertisements or advertisers.
© 2007-2025 - Fusion Media Limited. All Rights Reserved.
