Utilizing a portfolio of mutual fund investments is a topic I have addressed in my book, Stock Investing for Students. Investing with these securities represents a longer-term investment plan than covered call writing and selling cash-secured puts.
A significant number of retail investors use financial advisors to select various mutual funds for their portfolios in hopes of generating the highest possible returns. In exchange for their management skills and guidance, these advisors are paid a commission frequently based on a percentage of the net worth of our portfolios, usually between 1-2%.
Let me premise this article by stating that there are many outstanding financial consultants who are worth every penny of the fees we pay them. I understand that there are hard-working retail investors who would prefer to have a professional manage their hard-earned money. I get it. However, I will never stop stressing the importance of educating ourselves to the point where we can at least evaluate the performance of the investments these advisors have put us in and therefore the success or lack thereof of our money managers.
In this article, I will highlight one approach to such an evaluation process to generate a “report card” for the mutual funds in our portfolio and therefore for our wealth managers or ourselves if we selected the funds. First some definitions.
Definitions
Mutual Fund: Mutual funds are investment vehicles that allow us to pool our money together with other investors to purchase a collection of stocks, bonds, or other securities that might be difficult to recreate on our own.
Actively-managed Mutual Funds: These funds utilize the human element, such as a single manager or a team of managers, to actively manage a fund’s portfolio. They depend on analytical research, forecasts, and their own judgment and experience in making investment decisions.
Passively-Managed Mutual Funds: These funds operate the opposite of active management, better known as “indexing”, where a fund’s portfolio mirrors a market index. They are normally associated with low operating expenses and low portfolio turnover.
Developing our “report card” for our mutual funds and financial advisors
If we are paying a fee (well-deserved in many cases) to our advisors, then we would expect that the actively-managed mutual funds selected for our portfolios would out-perform index-based mutual funds (“the market”) by at least the amount of the fees we are paying them. If this is the case, these specialists are worth their weight in gold. However, if the funds are under-performing the overall market performance, should we not re-evaluate who we are trusting with our hard-earned money?
The Kip 25
In May of 2015, I read an article titled Kiplinger’s 25 Favorite No-Load Funds. A no-load fund is a mutual fund in which shares are sold without a commission or sales charge. The reason for this is that the shares are distributed directly by the investment company, instead of going through a secondary party. The article is typical of other such financial advisory publications. The goal of this article is to show a 1-year performance comparison of this list of actively-managed mutual funds to a broad market benchmark index fund.
For the benchmark fund, I have selected Vanguard 500 Index Fund Admiral Shares (VFIAX). I made this selection based on the facts that the S&P 500 is universally accepted as a reflection of the broad “market” and Vanguard funds generally have very low expense ratios (low administrative costs).
Price chart analysis
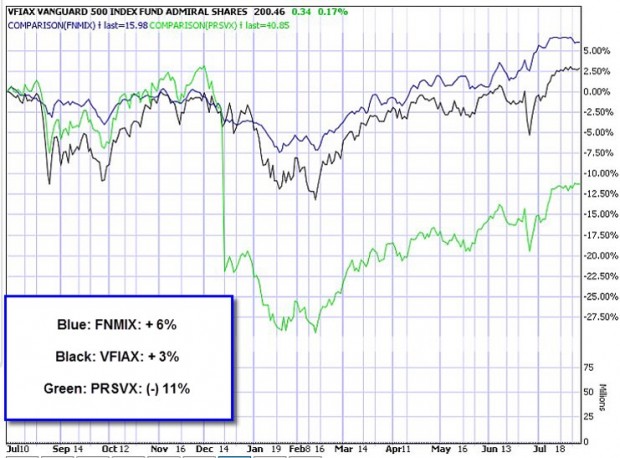
I charted each of the funds in the KIP 25 against the Vanguard benchmark fund to generate 1-year price performance percentiles. Here is a screenshot of the best-performing fund (FNMIX), the worst-performing fund (PRSVX) and the benchmark (VFIAX).

Mutual Fund Comparison Chart (Investools, Inc.)
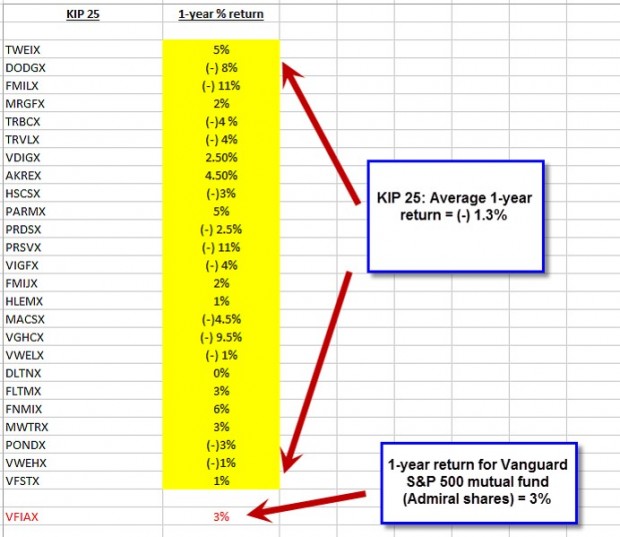
Spreadsheet showing all 26 1-year returns

Kip 25 versus the S&P 500 Benchmark Fund
The spreadsheet shows that, over a 1-year time frame, the KIP 25 declined in value by 1.3%, on average. In that same period, the benchmark index fund appreciated in value by 3%.
Discussion
This exercise is in no way a commentary on Kiplinger Advisory service. It is fair to assume that competent advisors would move clients in and out of funds as new information becomes available. However, it is fair to say that this brief exercise does highlight the importance of having the ability to evaluate the performance of both our securities and that of our advisors. Generally, index funds with low expense ratios will outperform actively-managed mutual funds although there are exceptions to this rule.
Market tone
Global stocks extended gains this week assisted by upbeat economic data and continued hopes for US fiscal stimulus. Oil prices solidified, with West Texas Intermediate crude rising to $53.90 from $53.25 before the holidays. The Chicago Board Options Exchange Volatility Index (VIX) was little changed at 11.28. This week’s reports and international news of importance:
- The United States added 156,000 new jobs in December while the unemployment rate edged up to 4.7%
- A 2.9% annual rise in average hourly earnings was the most significant aspect of Friday’s report. It was the largest yearly gain in wages since 2009. Rising wages, could negatively impact corporate earnings down the road and may keep the US Federal Reserve on guard for additional rate hikes in the months ahead
- The US reported a wider trade deficit on Friday, with a fall in exports likely to trim economic growth estimates for the fourth quarter. The deficit expanded to $45.2 billion in November, a nine-month high, from $42.4 billion in October
- Solid purchasing managers’ surveys from December were reported early this week, suggesting that the uptick in global growth seen in recent months continued through year-end
- The US reported its 91st consecutive month of manufacturing growth, with the Institute for Supply management index rising to 54.7 from 53.2
- The United Kingdom’s manufacturing purchasing managers’ index rose to 56.1, the highest in two and a half years
- The weaker euro helped boost the eurozone PMI to 54.4
- China’s Caixin PMI, which focuses on small and medium-size companies, rose to 51.9, its highest level since January 2013
- Global auto manufacturers sold a record-setting 17.55 million new cars and light trucks in the US in 2016, according to research firm Autodata
- For the first time in nearly three years, Australia recorded a trade surplus in November
- Many US retailers struggled this holiday season as sales continued to migrate to the Internet. Two notable cases were Macy’s and Sears, traditional anchor tenants of US shopping malls, which each announced the closure of more than 100 stores
THE WEEK AHEAD
- Monday January 9th: Consumer credit, Eurozone unemployment stats
- Tuesday January 10th: Wholesale inventories
- Thursday January 12th: Weekly jobless claims, Federal Budget
- Friday January 13th: Retail sales, producer price Index, consumer sentiment and business inventories
For the first week in 2017, the S&P 500 rose by 1.71%.
Summary
IBD: Market in confirmed uptrend
GMI: 5/6- Buy signal since market close of November 10, 2016
BCI: I am currently fully invested and have an equal number of in-the-money and out-of-the-money strikes.
WHAT THE BROAD MARKET INDICATORS (S&P 500 AND VIX) ARE TELLING US
The 6-month charts point to a moderately bullish outlook. In the past six months, the S&P 500 was up 9% while the VIX (11.28) declined by 25%.
