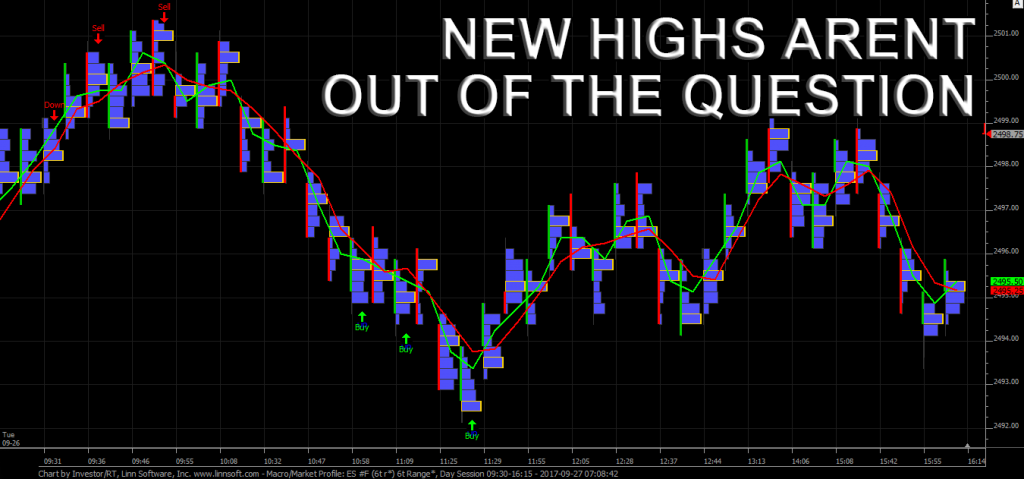
The S&P 500 futures (ESZ17:CME) traded down to 2492.75 on Globex Monday night, but rallied as the European indices firmed up, pushing the ES upto an early high of 2497.50. On the 8:30 CT futures open the ES traded 2498.50, and then rallied up to 2501.25 just before 9:00. After the high was made, the Nasdaq 100 futures (NQZ17:CME) sold off down to 5866.00, taking the ES down to its low at 2492.25. After a few hours of ‘back and fill’ price action, the ES traded back up to 2498.25 at 12:15, when the NQ popped back up to 5906.25 as Apple (NASDAQ:AAPL) was making new highs. The ES traded 2499.25 and sold off down to 2496.50 just after 1:00 when the NQ started to back off. At 1:30 the MiM was showing $787 million to sell. The ES ‘sluggishly’ traded back up to 2498.75 as the MiM showed $794 million for sale. On the 2:45 cash close the net imbalance on the NYSE ended up $870 million for sale, and the ES down ticked down to 2496.25.
After 2:45, the ES traded down to 2493.50, as the NQ ‘dumped’ back down going into the 3:00 cash close. The PitBull said before the late down tick that the total volume on the NYSE was only 591 million shares, and that there is just no interest in trading right now, and I think he is 100% correct. Total volume just before 3:00 was 1 million ES contracts, which includes 156,000 from Globex. In the end the S&P 500 futures (ESZ17:CME) settled at 2495.50, down -1.50 handles, or -0.06%, the Dow Jones futures (YMZ17:CBT) settled at 22259, down -17 points, or -0.07%, and the Nasdaq 100 futures (NQZ17:CME) settled at 5892.50, up +16.00 points, or +0.27%.
It was a very slow day. For the most part, the ES was stuck in a 2 to 3 handle trading range. We really can not add much more other than the continued selling in tech stocks which seemed to put a cap on the ES.
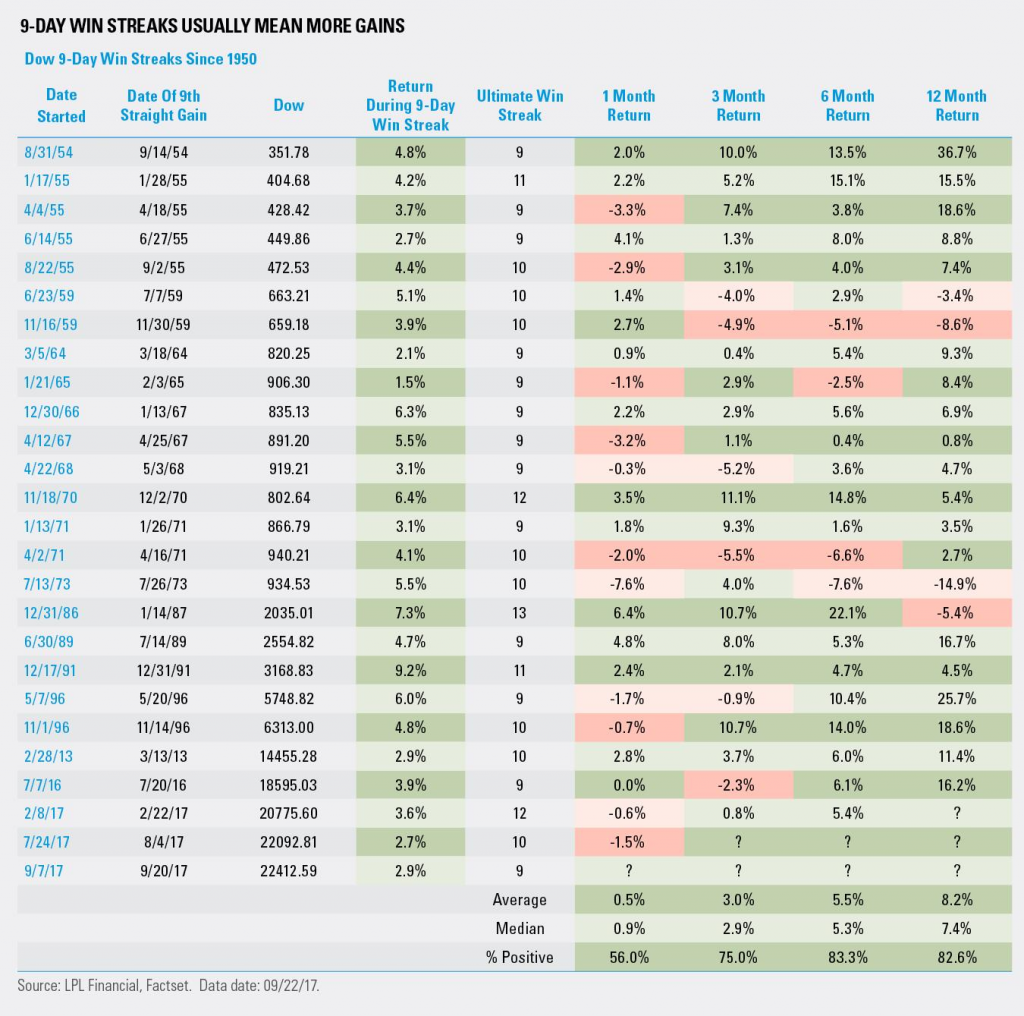
‘9-Day Winning Streaks Usually Mean More Gains’
Below is a graph by FactSet.com. I have been calling for new ES contract highs this week, and still think it’s possible, but the non-stop rotation and tech selling are holding the S&P back.

While You Were Sleeping

Today’s economic and earnings calendar includes the MBA Mortgage Applications (7:00 a.m. ET), Durable Goods Orders (8:30 a.m. ET), Pending Home Sales Index (10:00 a.m. ET), EIA Petroleum Status Report (10:30 a.m. ET); Fedspeak — Neel Kashkari Speaks (9:15 a.m. ET), James Bullard Speaks (1:30 p.m. ET), Eric Rosengren Speaks (7:00 p.m. ET); Earnings –Jabil (4:00 p.m.), Thor Industries (4:15 p.m. ET), Pier 1 Imports (4:15 p.m. ET), Progress Software (4:15-30 p.m. ET), Worthington Industries (4:30 p.m. ET).
Overnight, equity markets in Asia traded mixed, with a slight bias to the upside, and were led by the Hang Shen, which closed up +0.47%. Meanwhile, in Europe, stocks have been accelerating across the board overnight, and are being led by the DAX, which is currently up +0.50%.
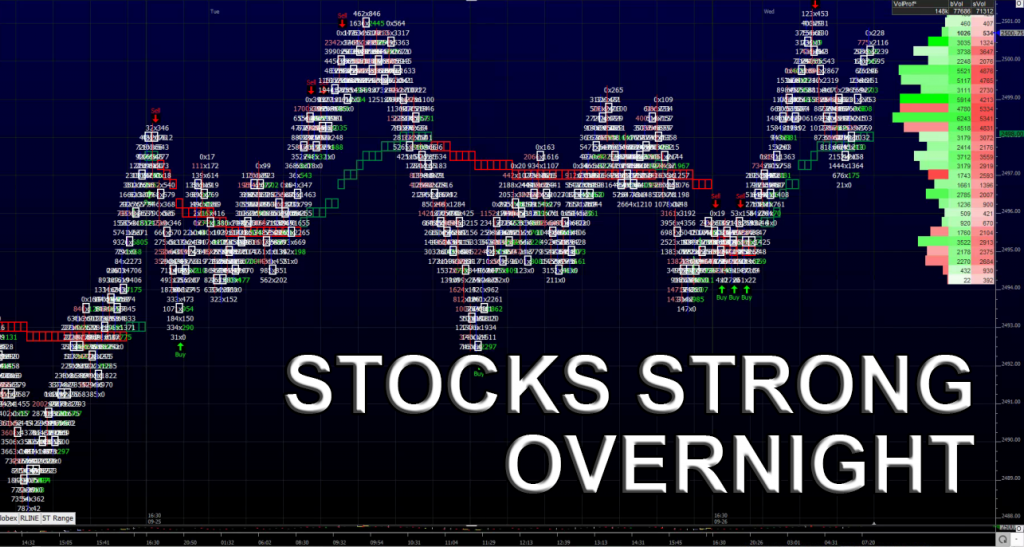
In the U.S., the S&P 500 futures opened last night’s globex session at 2495.00, and found the overnight low at 2494.25 in the first half hour of trading. Despite being held to just a 7 handle range, the ES has shown strength since the open. As of 7:00am CT, the last print in the ES is 2500.00, up +4.50 handles, with 140k contracts traded.
In Asia, 6 out of 11 markets closed higher (Shanghai +0.06%), and in Europe 10 out of 12 markets are trading higher this morning (FTSE +0.28%).
Today’s economic includes MBA Mortgage Applications, Durable Goods Orders, Neel Kashkari Speaks, Pending Home Sales Index, EIA Petroleum Status Report, a 2-Yr FRN Note Auction, a 5-Yr Note Auction, James Bullard Speaks, and Eric Rosengren Speaks.
Sluggish Trade Continues
Our View: http://money.cnn.com/data/fear-and-greed/There are not a lot of home runs out there right now. If you trade futures for a living, you gotta get in and get out, and don’t fall in love with your positions. Volume and interest in trading is low, which you can see by CNN’s ‘Fear and Greed’ index ( ). Trader Dave said he likes using the CNN Fear Greed index to confirm other sentiment indexes. For longer term signals. He said he waits until the 10 day moving average in green turns lower when it is in overbought territory. He said right now the gauge is still trending up and would not expect any large down moves until it slopes lower. Despite the continued tech weakness we still think the selling is temporary…
Our view; you can sell the early rallies and buy weakness, or just buy weakness.

