Market Brief
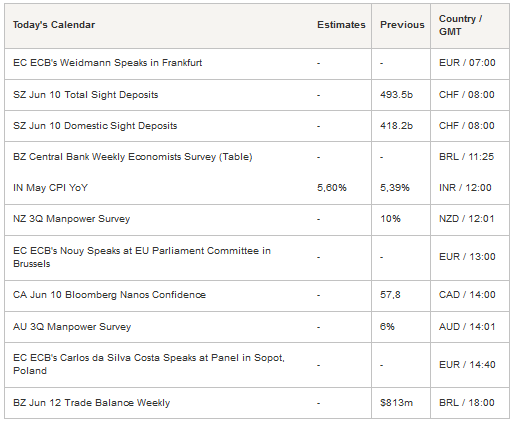
G10 currencies traded mostly sideways in Asia on Monday ahead of this week's FOMC meeting. The probability of a rate hike has significantly decreased since the last jobs report and is now close to zero (chance of a move hit 1.1% this morning - extracted from OIS swap). The market will however pay particular attention to the tone and words used in the press conference as well as to the dot plot evolution. The US Dollar Index is therefore exposed to significant downside risk amid mounting uncertainties about the ability of the US economy to weather a monetary policy tightening.

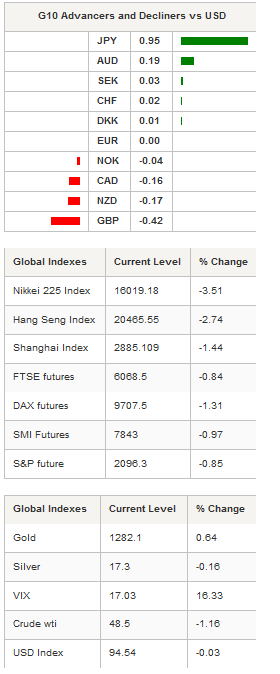
The risk off environment is also weighing heavily on equities, which dropped across the globe but helped gold to recover. The S&P 500 slid more than 1% last week, the Euro Stoxx 600 fell 4.10% and the SMI was off 3.60%. The sell-off accelerated in Asia on Monday with the spread of risk-off sentiment. In Japan, the Nikkei was off 3.51% and the broader Topix index slid 3.47%. In mainland China, the CSI 300 was down 1.45%. Offshore, Hong Kong’s Hang Seng fell 2.74%, while Taiwan’s Taiex eased 2.05% to 8,536 points. The yellow metal has been finding a decent amount of buyers since the beginning of the month as investors seek out an alternative to equities. Gold jumped 0.64% in Tokyo to $1,282.10, the highest level since May 16th. In Europe, equity futures are blinking red, signalling a lower open.
In China, the latest batch of economic data painted a mixed picture of the world’s second largest economy with May industrial production printing in line (6%y/y) and May retail sales easing to 10%y/y from 10.1% in the previous month. Finally, fixed investment missed the median forecast and printed at 9.6% (year-to-date), versus an expected 10.5%. As usual, Chinese turmoil is putting its main trade partners, such as Australia, at risk. AUD/USD hit 0.7659 in the early Asian session before bouncing back to 0.7395 as the USD falters. On the upside, a resistance can be found at 0.7504, while on the downside a support lies at 0.7315 (low from June 6th).
USD/JPY was the biggest loser this morning with a drop of roughly 1% as investors sought safe haven assets. With constant upside pressure on the JPY, we believe that the BoJ will not wait long before moving from words to action and increase its stimulus. On the downside, a support can be found at 105.55 (low from May 3rd), while on the upside a first resistance area can be found at around 107.

Currency Tech
EUR/USD
R 2: 1.1479
R 1: 1.1416
CURRENT: 1.1266
S 1: 1.1132
S 2: 1.1098
GBP/USD
R 2: 1.4770
R 1: 1.4660
CURRENT: 1.4187
S 1: 1.4132
S 2: 1.4006
USD/JPY
R 2: 109.14
R 1: 107.89
CURRENT: 106.06
S 1: 105.55
S 2: 103.56
USD/CHF
R 2: 0.9920
R 1: 0.9783
CURRENT: 0.9633
S 1: 0.9533
S 2: 0.9444
