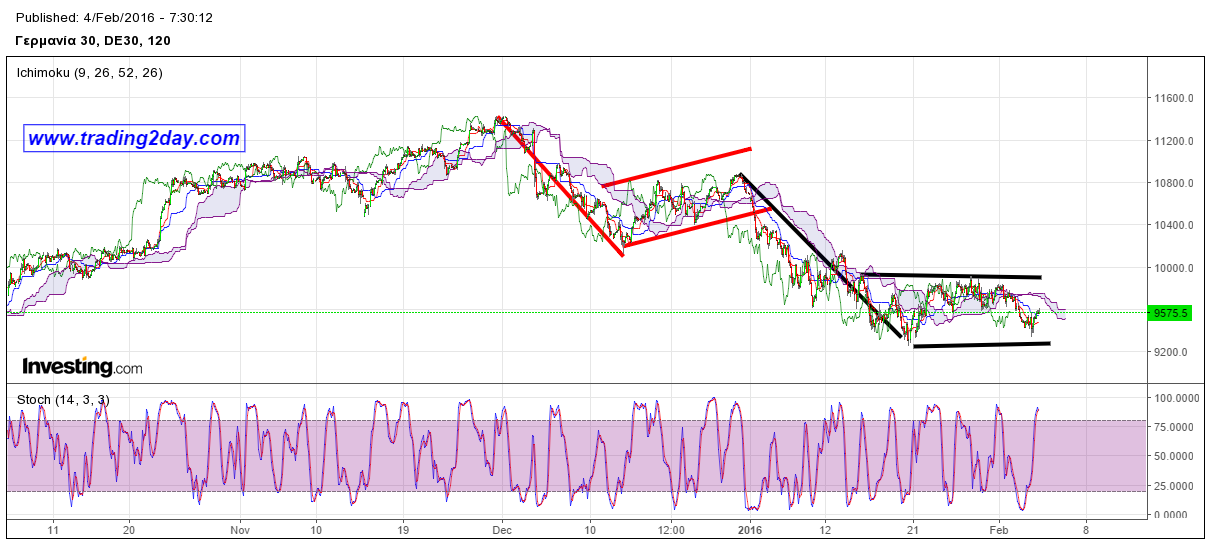
DAX has formed another bearish flag pattern with boundaries ranging from 9250 to 9900. The last time DAX has formed a similar pattern and broke down was in December. In the chart below you can see both cases and as long as we hold above 9250 one can try to get bullish. Cancellation of this bearish pattern will come once we break above 9900.
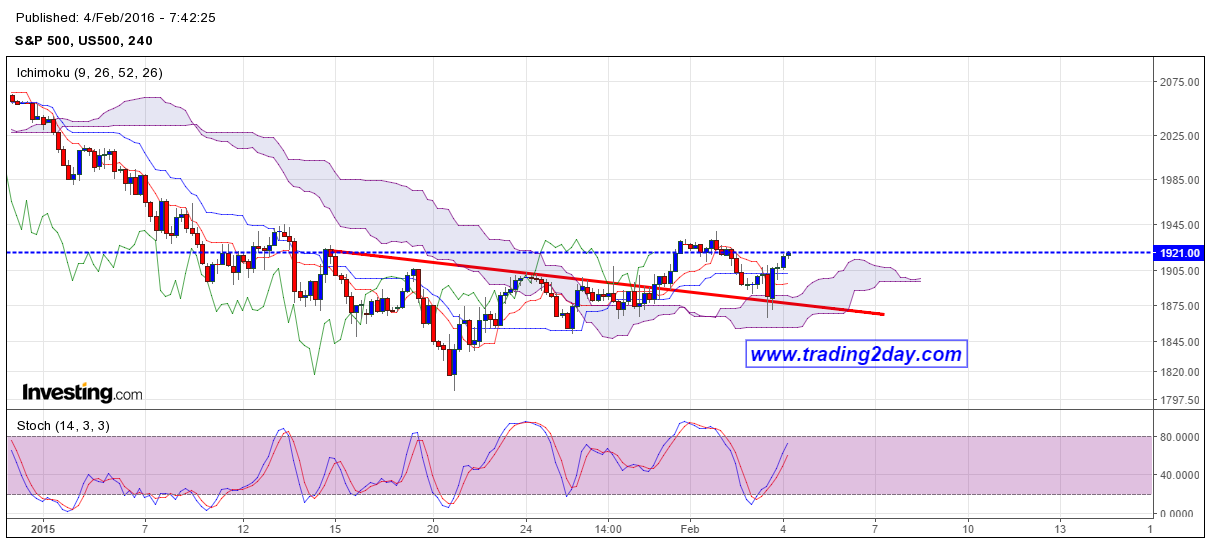
A promising bullish pattern is formed in the SPX as price has back tested the broken neckline and the Ichimoku cloud in the 4 hour chart as shown below. A break above 1940 will open the way for a move towards 2000 points level but a break below 1865 will be a huge bearish signal with targets near 1750-1770.
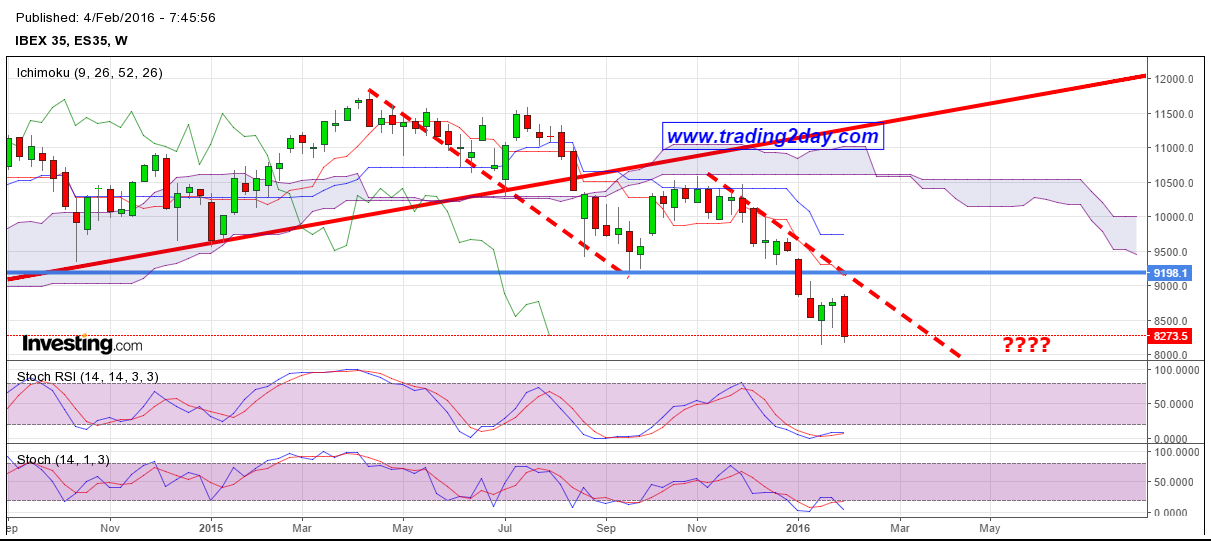
Approaching our target of 8000 points level. I believe this is the time for some profit taking.
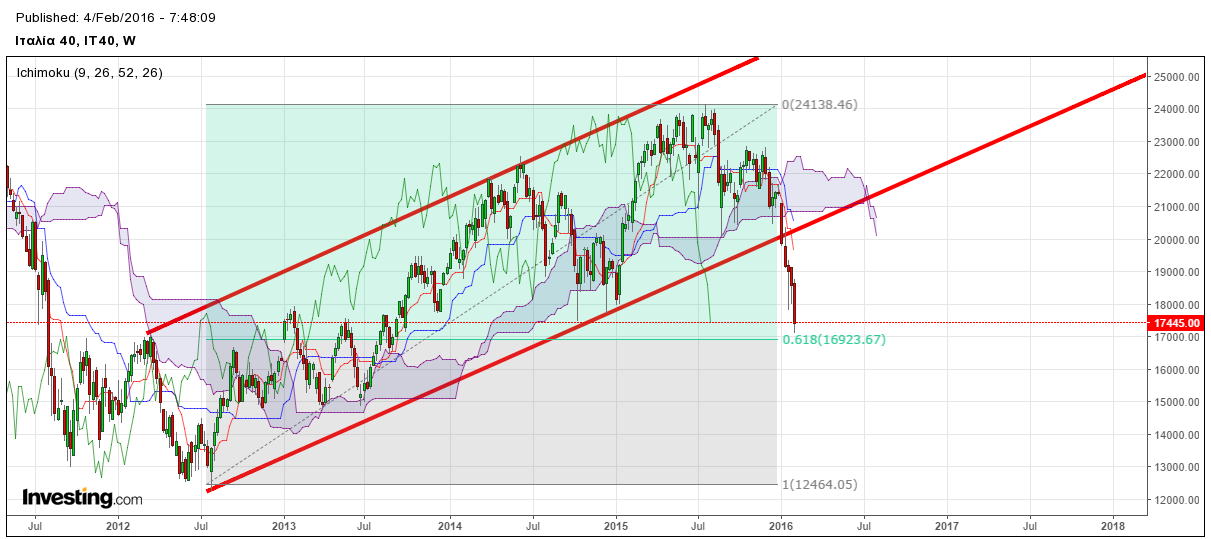
Is approaching the 61.8% Fibonacci retracement after breaking below the long-term upward sloping channel.

Price has dropped so far in a three wave pattern and this can very well be the end of the entire correction.
Taking into account the reversal in SPX, MIB and Ibex approaching important support levels and DAX still holding above 9250 support, equity indices could be preparing for a multi week rally. So bears should be cautious and reassess their protective stop levels.
Disclosure: None of the information or opinions expressed in this blog constitutes a solicitation for the purchase or sale of any security or other instrument. Nothing in this article constitutes investment advice and any recommendations that may be contained herein have not been based upon a consideration of the investment objectives, financial situation or particular needs of any specific recipient. Any purchase or sale activity in any securities or other instrument should be based upon your own analysis and conclusions.


