
EU and US equities rebounded yesterday after US President Trump said that Saudi Arabia and Russia are expected to agree on oil production cuts of up to 10-15mn bpd. Oil prices recorded their biggest daily percentage gains in history, but during the Asian morning today, they retreated. As for today, investors may pay attention to the US jobs data for March, as well as to the ISM non-manufacturing index for the same month.
OIL PRICES RALLY ON TRUMP’S REMARKS
The dollar traded higher against all but two of the other G10 currencies on Thursday and during the Asian morning Friday. It gained the most versus EUR, SEK and CHF in that order while it lost some ground versus CAD. The greenback was found virtually unchanged against NOK.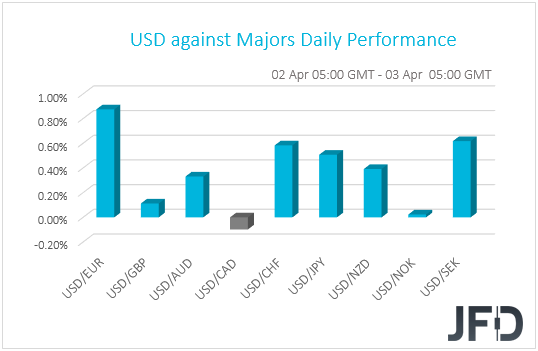
The fact that the greenback continued to strengthen suggests that market participants remained concerned with regards to the economic damages caused by the fast spreading of the coronavirus. Indeed, after the initial jobless claims more-than-doubled their prior record of 3.3mn, shockingly hitting 6.65mn and topping the upper end of the economists’ forecasts (5.25mn), global equity indices traded in negative waters.
However, most major EU and US indices finished their sessions in green territory, gaining after US President Trump said he expects Saudi Arabia and Russia to agree to an oil production cut of up to 10-15mn barrels per day, as the two nations appeared willing to find common ground. On top of that, Saudi Arabia said it would call for an emergency OPEC gathering, as the prior output-cut deal expired on March 31st. Oil prices jumped on the reports, with both Brent and WTI surging 21.02% and 24.67% respectively, their biggest daily gains percentage-wise on record. Maybe that’s why both CAD and NOK were among the top G10 performers. Let’s not forget that both the Canadian and Norwegian economies depend heavily on oil exports. So why did the dollar continued to gain even after the rebound in oil prices and equity indices? Perhaps because the US is the top oil producing nation in the world.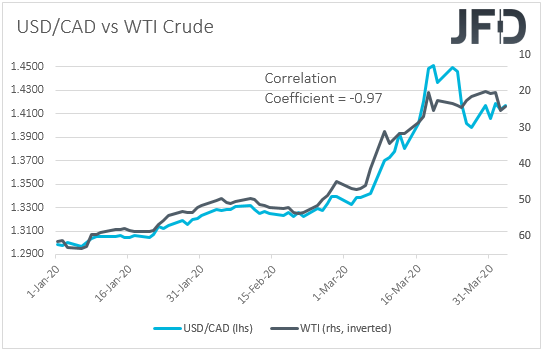
Having said all that, oil prices retreated during the Asian session today, dragging equity indices along with them. Although Japan’s Nikkei 225 closed virtually unchanged, at the time of writing, China’s Shanghai Composite and Hong Kong’s Hang Seng are down 0.86% and 0.82% respectively. Perhaps investors had second thoughts about the oil-related reports. With Saudi Arabia and Russia starting a price war after failing to agree on a 1.5mn bpd cut, how is it possible to agree on 10 or 15mn? Even if they agree to cut by a smaller amount, will this be enough to offset the plunge in demand due to the coronavirus pandemic? All these questions make us sit on the sidelines, despite yesterday’s rally. Even if oil prices rebound again, we are reluctant to trust a long-lasting recovery. In order to do so, we would like to see handshakes and signatures, not just headlines and rumors.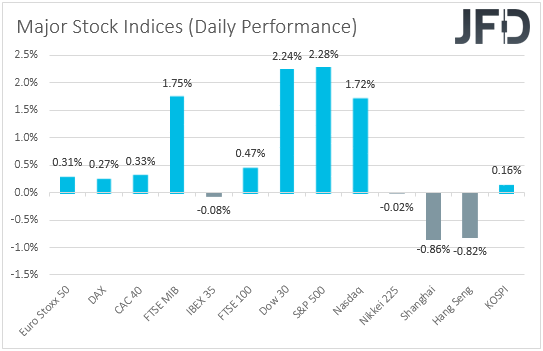
BRENT OIL – TECHNICAL OUTLOOK
This week Brent oil managed to drop slightly below the 23.05 hurdle, which is the lowest point of 2003, but didn’t close below it. Yesterday, the commodity spiked sharply to the upside, breaking a couple of its key resistance barriers, at 28.72 and 31.66. However, the daily candle still closed below the 28.72 hurdle and this morning we are seeing Brent oil retreating back down a bit. Given the whole current indecisiveness, we will take a neutral stance, at least for now.
If, eventually, we see the black liquid pushing back above the 28.72 zone, or even the 31.66 barrier, marked by the low of March 9th and near the high of March 17th, that may attract a few more buyers into the game. Such a move might help Brent oil to travel to the 36.43 hurdle, a break of which may send the price to the 39.94 level, which is the high of March 11th. A further acceleration could test a short-term tentative downside resistance line taken from the highest point of January.
Alternatively, if we see a daily close below the previously-discussed 23.05 hurdle, this may attract some more sellers and Brent oil could slide further south. That is when we will start aiming for the psychological 20.00-dollar mark. There might be a hold-up near that area, or we could even see a small rebound. That said, if the buyers are still not comfortable to jump in, the commodity may slide again. If the psychological 20.00 area breaks, that could clear the path to the 16.65 level, marked by the lowest point of 2001.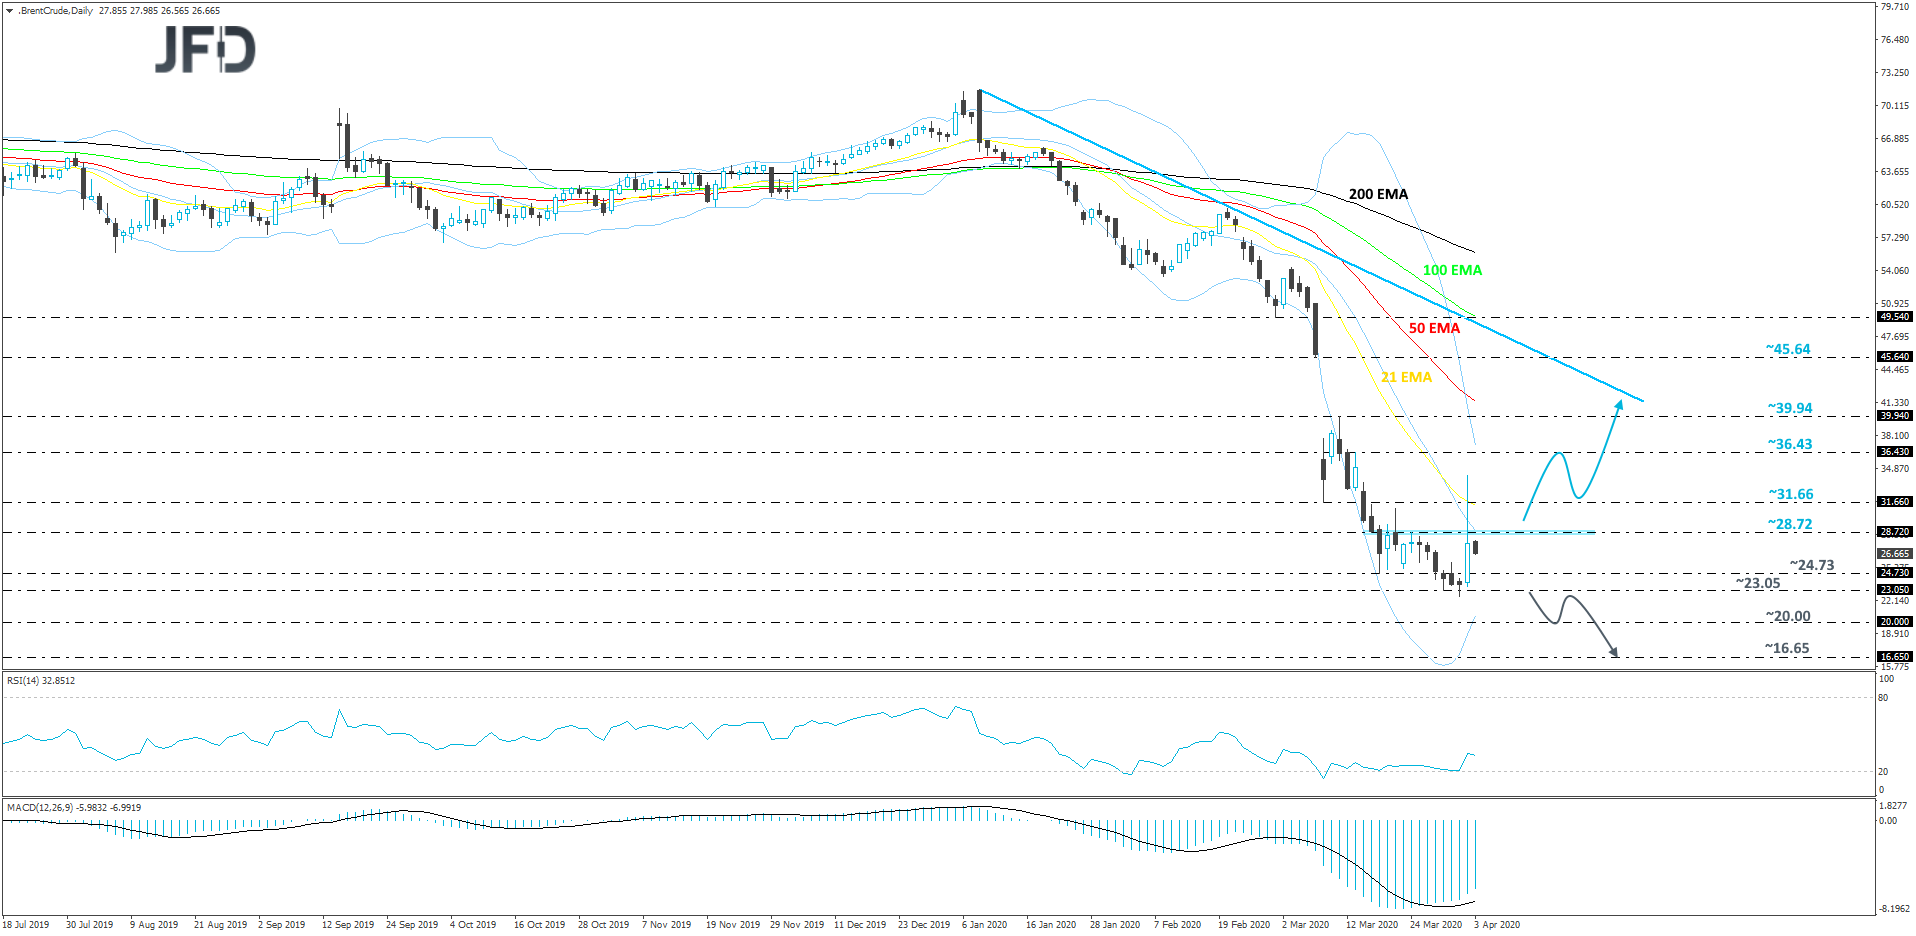
US JOBS DATA AND ISM NON-MANUF. PMI ON INVESTORS’ RADAR
As for today, the spotlight may turn to the official US employment data and the ISM non-manufacturing PMI, both for the month of March. Nonfarm payrolls are expected to have fallen 100k after rising 273k in February, while the unemployment rate is expected to have risen to 3.8% from 3.5%. Bearing in mind that the ADP (NASDAQ:ADP) report revealed that the private sector lost only 27k jobs, we wouldn’t be surprised if the NFPs decline by less than expected as well. That said, the ADP report appears to be far from a reliable predictor of the NFPs, as the correlation between the two time-series at the time of the release (no revisions are taken into account) has fallen notably in recent years. Average hourly earnings are anticipated to have slowed to +0.2% mom from +0.3%, which, barring any deviations to the prior monthly prints, would keep the yoy rate unchanged at +3.0%.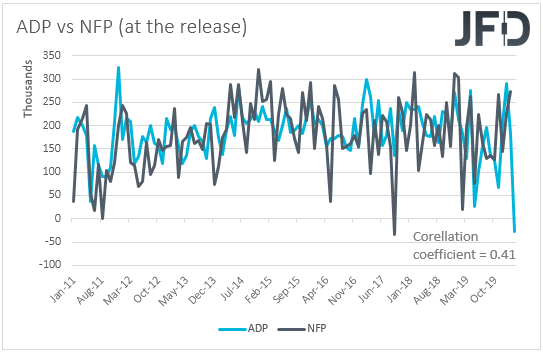
Having said all that, at this point we have to note that both the ADP and the official employment data are based on the total number of employees being active on a payroll through the 12th of the month, and thus they don’t reflect the latest impact of the virus on the job market. Investors may prefer to wait for the April data, which may incorporate the astonishing jumps in jobless claims in the last two weeks of March.
As for the ISM index, it is expected to have fallen to 44.0 from 57.3. Combined with the decline to 49.1 in the ISM manufacturing PMI, this would drive the 3-month rolling average of our ISM weighted composite index sharply lower, which could mean a steep slowdown, or even a contraction, for the US economy during Q1 of this year.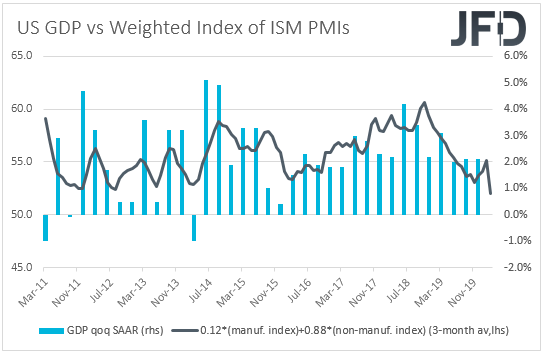
Something like that could increase concerns with regards to the effects of the coronavirus outbreak to the US economy and may trigger another wave of risk aversion. Equities are likely to slide again, and paradoxically, the dollar may strengthen. History has shown that in a dollar-denominated world, the greenback wears its safe-haven suit during periods of high uncertainty and market turbulence, even if a potential global economic fallout means deeper wounds for the US economy. Looking forward, we maintain the view that the worst is not behind us yet. With both new infected cases and deaths reaching new records yesterday, the lockdowns around the globe may drag longer than previously anticipated, which could hurt even more the global economy. Thus, we stick to our guns that there is room for equities to trade south again, as investors seek shelter in safe havens.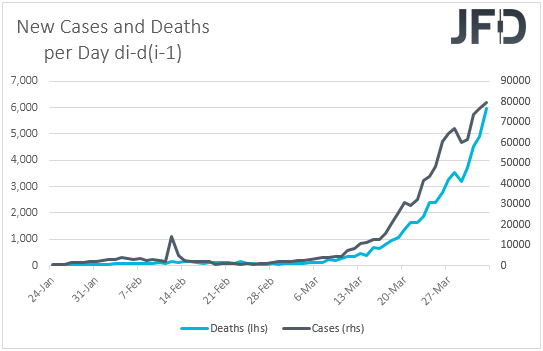
EUR/USD – TECHNICAL OUTLOOK
EUR/USD continues its journey lower, while trading below a short-term tentative downside resistance line taken from the high of March 30th. Yesterday, the pair found support near the 1.0820 hurdle, from which it rebounded somewhat this morning. That said, if the rate remains below that downside line, then the 1.0820 level could just be seen as a temporary obstacle on the way lower, hence why we will stay somewhat bearish, at least for now.
A drop below yesterday’s low, at 1.0820, would confirm a forthcoming lower low and such a move could open the door to some further declines. The pair might easily drift to the low of March 24th, at 1.0746, which could provide a bit of initial support. If so, the rate may rebound slightly higher, however, if it remains below the aforementioned downside line, this might lead to another round of selling. If the 1.0746 hurdle breaks, the next potential support area to consider may be the 1.0666 obstacle, marked by the low of March 23rd.
On the other hand, if the previously-mentioned downside line breaks and the rate climbs above the 1.0953 barrier, marked near the lows of March 17th, 27th and near the intraday swing highs of March 19th and April 2nd, such a move may attract a few more buyers into the game. This could help lift the rate towards the 1.1037 obstacle, a break of which might clear the path to the 1.1147 level, marked by the high of March 27th.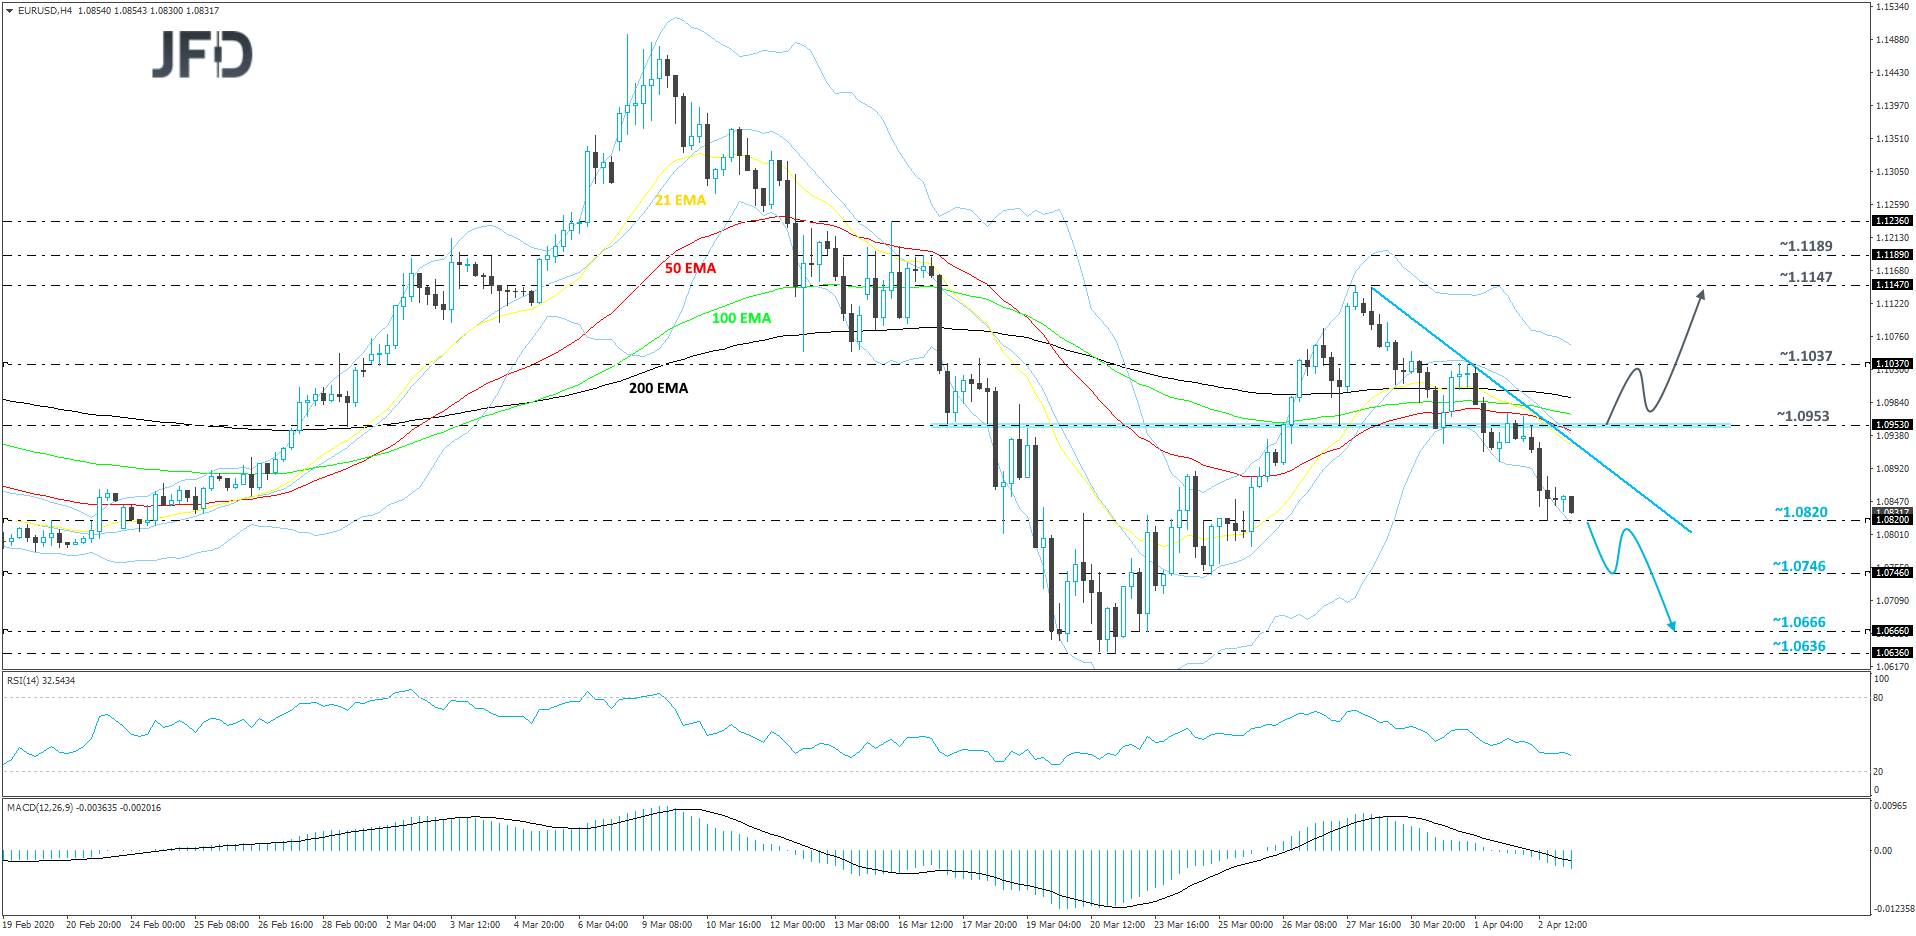
AS FOR THE REST OF TODAY’S EVENTS
We have the final Markit services and composite PMIs for March from the Eurozone, the UK and the US, and as it is the case most of the times, they are expected to confirm their preliminary estimates. Eurozone’s retail sales for February are also coming out and the forecast suggests a slowdown to 0.1% mom from +0.6%. This may keep the yoy rate unchanged at +1.7%.
- English (UK)
- English (India)
- English (Canada)
- English (Australia)
- English (South Africa)
- English (Philippines)
- English (Nigeria)
- Deutsch
- Español (España)
- Español (México)
- Français
- Italiano
- Nederlands
- Português (Portugal)
- Polski
- Português (Brasil)
- Русский
- Türkçe
- العربية
- Ελληνικά
- Svenska
- Suomi
- עברית
- 日本語
- 한국어
- 简体中文
- 繁體中文
- Bahasa Indonesia
- Bahasa Melayu
- ไทย
- Tiếng Việt
- हिंदी
Equities Rebound After Oil Surge; NFPs In Focus
Published 04/03/2020, 03:59 AM
Updated 07/09/2023, 06:31 AM
Equities Rebound After Oil Surge; NFPs In Focus
Latest comments
Loading next article…
Install Our App
Risk Disclosure: Trading in financial instruments and/or cryptocurrencies involves high risks including the risk of losing some, or all, of your investment amount, and may not be suitable for all investors. Prices of cryptocurrencies are extremely volatile and may be affected by external factors such as financial, regulatory or political events. Trading on margin increases the financial risks.
Before deciding to trade in financial instrument or cryptocurrencies you should be fully informed of the risks and costs associated with trading the financial markets, carefully consider your investment objectives, level of experience, and risk appetite, and seek professional advice where needed.
Fusion Media would like to remind you that the data contained in this website is not necessarily real-time nor accurate. The data and prices on the website are not necessarily provided by any market or exchange, but may be provided by market makers, and so prices may not be accurate and may differ from the actual price at any given market, meaning prices are indicative and not appropriate for trading purposes. Fusion Media and any provider of the data contained in this website will not accept liability for any loss or damage as a result of your trading, or your reliance on the information contained within this website.
It is prohibited to use, store, reproduce, display, modify, transmit or distribute the data contained in this website without the explicit prior written permission of Fusion Media and/or the data provider. All intellectual property rights are reserved by the providers and/or the exchange providing the data contained in this website.
Fusion Media may be compensated by the advertisers that appear on the website, based on your interaction with the advertisements or advertisers.
© 2007-2025 - Fusion Media Limited. All Rights Reserved.