Dow Jones Averages are price weighted indices, while most of the broad market indices such as S&P 500 and Nasdaq 100 are market-cap weighted. In a price-weighted index, higher prices will influence the direction of the average more than lower prices, regardless of the actual size of the company.
Dow Jones Composite Index measures changes within the 65 companies that make up three Dow Jones averages: the 30 stocks that form the Dow Jones Industrial Average (DJIA), the 20 stocks that make up the Dow Jones Transportation Average (DJTA) and the 15 stocks of the Dow Jones Utility Average (DJUA). The Dow Jones 65 Composite, like the three sub-indexes, is price-weighted.
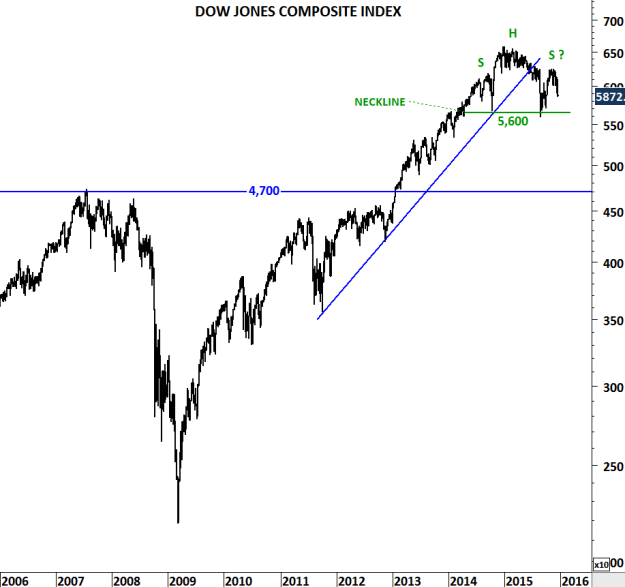
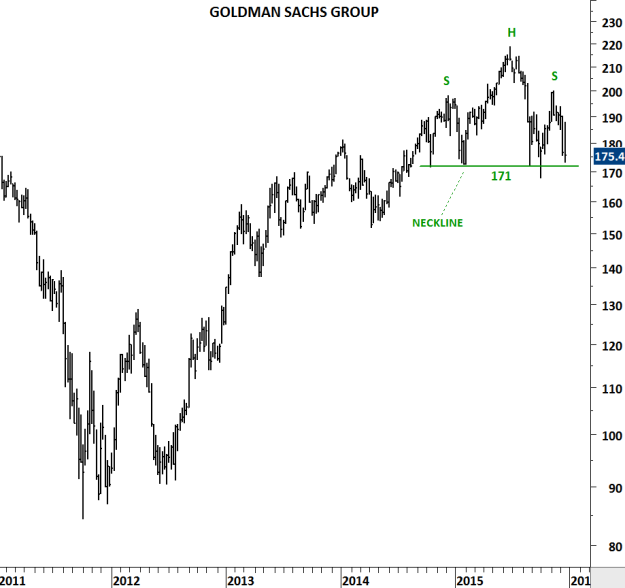
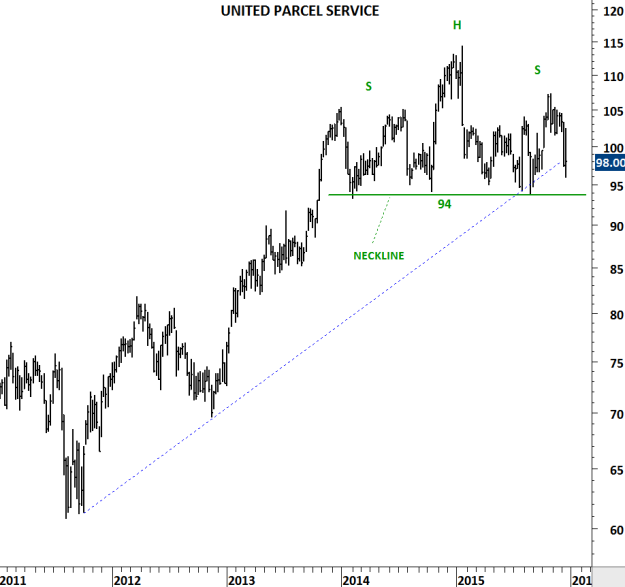
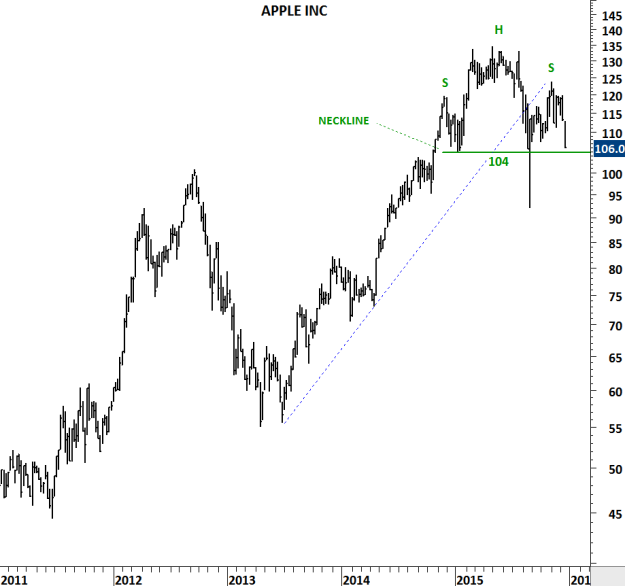
Over the past two years Dow Jones Composite Index has formed a top formation usually regarded as Head & Shoulder. Head and shoulder chart pattern forms after a prolonged uptrend and signals a possible change in trend. Chart pattern is confirmed with the breakdown of the neckline. Similar chart patterns can be seen on some of the constituents of the top US indices. If not in the next few weeks, the first quarter of 2016 we can see some corrective price action on these charts. Confirmation of such price movement will be a decisive break below horizontal support levels (neckline).


