Monday November 28: Five things the markets are talking about
Expectations that a OPEC production deal would unravel, a possible defeat in Sunday’s referendum in Italy and elections in Austria, coupled with the U.S presidential transition challenge of polls in battleground states by Clinton is dominating early trading.
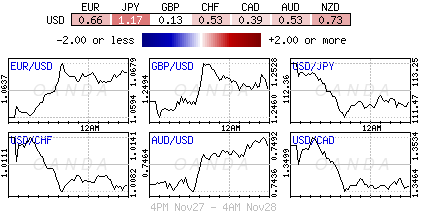
Consolidation in bonds and equities has been relatively muted compared with the forex market – the U.S dollar has started this week, succumbing to profit taking after recent strong gains in the wake of Trump’s election victory and on expectations of Fed rate increases.
The drop in oil prices is hitting U.S. inflation expectations, which is pulling down U.S. Treasury yields and finally knocking back this lengthy dollar rally.
A raft of U.S. economic data is due this week – ISM manufacturing data and nonfarm payroll (NFP) – is also strengthening the case for selling dollars as stimulus-driven Trump presidency appears to have run its course for now?
Don’t be surprised to see many adopt a “wait and see” approach, at least until there is some greater market clarity.
1. Fall in U.S yields aids EM stocks
The prospects of reduced upward pressure on inflation from oil prices, is putting pressure on U.S rates and bringing some relief to Asian indexes. To date, they have been underperforming on worries about capital flight to higher-yielding U.S assets.
MSCI’s broadest index of Asia-Pacific shares ex-Japan rallied +0.6%, led by gains in Hong Kong and Taiwan.
Elsewhere, Japan’s Nikkei 225 closed down -0.1% on the back of a stronger yen (¥112.00), while Australia’s S&P/ASX 200 was off -0.8%.
In Europe, both the Stoxx 600 and FTSE 100 are off more that -1%, pressured mostly by commodity and energy stocks.
S&P futures are set to open down -0.4% after the benchmark set a new all-time high Friday.
Indices: Stoxx50 -1.0% at 3,018, FTSE -0.9% at 6,781, DAX -1.0% at 10,589, CAC 40 -0.9% at 4,507, IBEX 35 -0.5% at 8,627, FTSE MIB -2.0% at 16,190, SMI -0.5% at 7,844, S&P 500 Futures -0.4%.
2. Oil prices under pressure
OPEC is making a last-ditch effort to secure agreement for production cuts even as Saudi Arabia is now suggesting reduction of output is not needed.
The Saudi energy minister said yesterday that he believed the oil market would balance itself in 2017 even if producers did not intervene, and that keeping output at current levels could therefore be justified.
Ministers are flying to Russia for talks ahead of the meeting in Vienna this Wednesday.
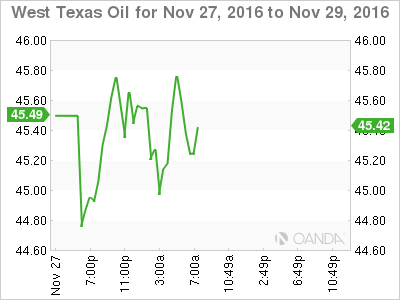
Brent futures last traded at +$47.13 per barrel, down slightly on the day, after having fallen by as much as -2.0% in early Asian trade, following on from its -3.6% fall on Friday. West Texas Intermediate crude (WTI) has slipped -1.1% to +$45.57 a barrel, extending its declines after Friday’s -4% drop.
If a deal cannot be agreed upon on Wednesday, some analysts expect a sharp correction lower, potentially going as low as +$35 per barrel on big inventories and supply overhang issues.
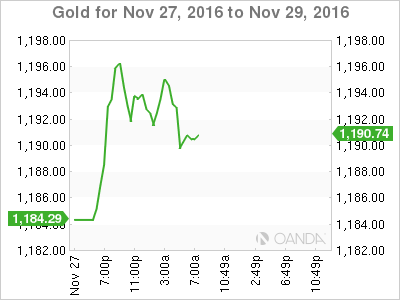
Spot gold prices have found some traction on a weaker dollar, gaining +0.9% to +$1,194.49 an ounce following last week’s -2% decline, its third consecutive weekly retreat.
Industrial metals continue to find support from bullish speculative sentiment out of China; zinc has rallied another +3.5%, heading for its highest monthly close in nine-years.
3. U.S Yields fall and flatten curve
The drop in crude prices is hitting U.S. inflation expectations and pulling down Treasury yields.
U.S. 10-Year prices have rallied overnight for the first time in three sessions, pushing yields down -3bps to +2.33% and off its 16-month high print of +2.417% touched last Thursday.
Elsewhere, yields on Australia 10-Year notes lost -7bps to +2.69%, while yields on similar maturity in Japan, New Zealand and Hong Kong fell at least -2bps.
4. EM currencies enjoy a good day
A handful of emerging-market currencies have enjoyed a strong session overnight to start the week, spurred on by a weaker dollar index (DXY down -0.6%).
EM pairs have had a torrid few weeks since Trump’s surprise election win. The “reflation” trade and potential protectionist policies have seen a flight of capital from certain regions.
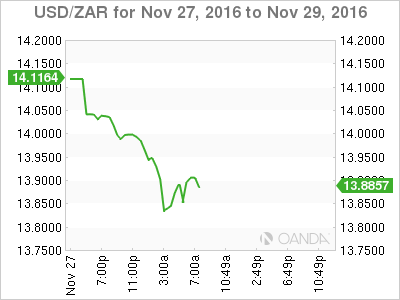
The South African rand (ZAR) is up +2% outright, while the Turkish lira (TRY) is up +1.1% and the Mexican peso (MXN) has gained +0.7%.
MXN remains down -8.2% this month, while the rand and the lira are still down -2.5% and -9.1% respectively.
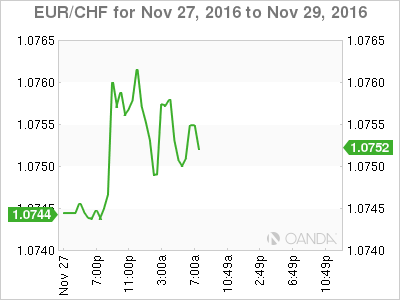
5. Swiss National Bank (SNB) likely intervening
Analysts note that another sizable increase in sight deposits at the Swiss National Bank (SNB) would suggest that the central bank continues to intervene in the forex market to weaken the CHF.
Sight deposits have rose nearly CHF +3B last week to CHF +527.6B and about CHF +8B in the past fortnight.
EUR/CHF trades atop of €1.0748, little changed from Friday’s close.
