Following futures positions of non-commercials are as of January 9, 2018.
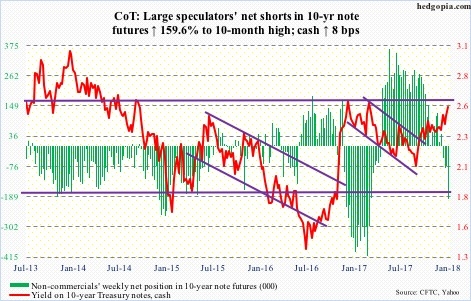
10-year note: Currently net short 196.9k, up 121k.
Is this the big one? The big breakout in 10-year yields, that is?
The 10-year has been trapped in a descending channel for three decades. Bonds made a killing during that period.
This week, 10-year yields rose eight basis points to 2.55 percent, and at one time were up as much as 12 basis points to 2.6 percent. At the highs, the 10-year clearly broke out of that channel. Even here, yields have managed to peek out of it.
Bill Gross, of Janus Henderson, says a bear market has been confirmed in bonds.
The significance of this week’s developments cannot be minimized.
Here is the thing.
Because it is a descending channel, the level where a breakout occurs constantly declines. It currently lies around 2.5 percent. A couple of months later, it will be lower. As time passes, a breakout is bound to happen – sooner or later. The bigger question is if this will entail portfolio reallocation.
Mr. Gross for one has gone short on bonds.
There might be others who are also looking at other levels before they decided to pull the rip cord, one of which lies at/near 2.6 percent, which is where this week’s rally got repelled – twice.
In December 2016, the 10-year peaked at 2.62 percent, which was once again tested – unsuccessfully – in March last year. A lot of investors/traders have their sights set on this level. Worth watching!
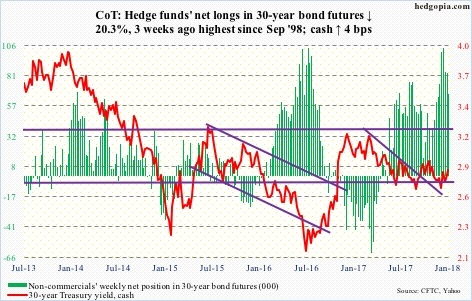
30-year bond: Currently net long 66.7k, down 17k.
Major economic releases next week are as follows. Markets are closed Monday in observance of Martin Luther King Jr. Day.
Wednesday brings industrial production (December), the NAHB housing market index (January), and Treasury International Capital data (November).
U.S. capacity utilization rose 2.2 percent year-over-year in November to 77.1 percent. Utilization peaked at 79.2 percent in November 2014, but has risen since bottoming at 75.4 percent in March 2016.
Builder sentiment rose five points month-over-month to 74 in December. This was the highest since 75 in July 1999.
In the first 10 months last year, foreigners net-purchased $78.8 billion in U.S. stocks. On a 12-month rolling total basis, purchases amounted to $68.1 billion – quite a reversal from February 2016 when they were selling $145.3 billion worth. U.S. stocks reached a major bottom in that month.
Housing starts (December) are due out Thursday. November was up 3.3 percent m/m to a seasonally adjusted annual rate of 1.3 million units – near the cycle high 1.33 million units in October 2016.
The University of Michigan’s consumer sentiment index (January, preliminary) is scheduled for Friday. Sentiment in December fell 2.6 points m/m to 95.9, and has come under slight pressure since last October’s 100.7, which was the highest since 103.8 in January 2004.
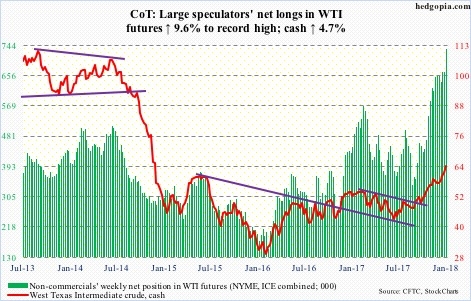
Crude oil: Currently net long 732.4k, up 64.3k.
Spot West Texas Intermediate crude ($64.30/barrel) Thursday rallied all the way to $64.77 – the highest since December 2014 – before sellers showed up. The session produced a shooting star. But the bulls are unlikely to give up easy.
Non-commercials are the most net long ever.
In the event of a pullback near term, nearest support lies at $62, followed by $59.
The EIA report – out Wednesday – for the week of January 5 contained more positives for the bulls than the bears.
U.S. crude production dropped a whopping 290,000 barrels per day to 9.49 million b/d. The all-time high of 9.79 mb/d was recorded three weeks ago.
Crude imports fell 308,000 b/d to 7.66 mb/d – a four-week low.
Crude stocks continued to contract – down 4.9 million barrels to 419.5 million barrels. This was the lowest since August 2015.
Gasoline and distillate stocks, however, rose – up 4.1 million barrels and 4.3 million barrels to 237.2 million barrels and 143.1 million barrels, respectively. They respectively were at 28- and 17-week highs.
Refinery utilization fell 1.4 percentage points. Last week’s 96.7 percent was the highest since August 2005.
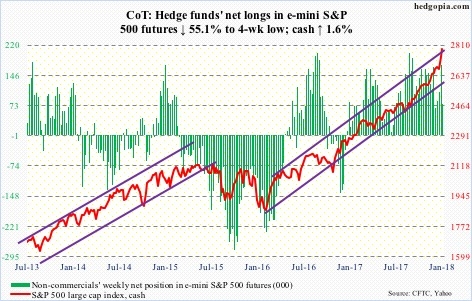
E-mini S&P 500: Currently net long 77.4k, down 95.2k.
Talk about beginning the new year with a bang. Nine sessions in, the cash is already up 4.2 percent. Both the weekly and monthly RSI is at 87-plus. As overbought as this metric is – along with several others – the bulls are not letting go of the ball.
Shorter-term averages are still rising. Buy-the-dip mentality prevails, and is working.
In the December 16-29 period, shorts got squeezed big time. Short interest on SPY (SPDR S&P 500 ETF (NYSE:SPY)) fell 27.2 percent period-over-period to 123.9 million. This likely continued this year, given the intensity of the rally.
Unlike in the prior week, flows fully cooperated in the week to Wednesday.
U.S.-based equity funds (including ETFs) took in $12 billion (courtesy of Lipper).
In the same week, per ETF.com, $2.6 billion came out of SPY, but this was more than offset by inflows of $714 million into VOO (Vanguard S&P 500 ETF) and $2.6 billion into IVV (iShares core S&P 500 ETF).
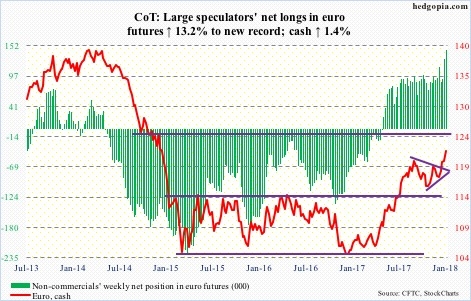
Euro: Currently net long 144.7k, up 16.8k.
The cash ($121.99) came under slight pressure early in the week, but the dip was scooped up near the 20-day. Further help came Thursday from the ECB.
The minutes for the December meeting delivered a slightly hawkish surprise for the markets. The bank said it could gradually shift its guidance from early 2018, and also that the view was widely shared by members of the governing council.
Come Friday, resistance at $120-plus, which goes back nearly two decades, was gone.
Last July, the euro broke out of a range. A measured-move target extends to 124-125. Similarly, a trend line drawn from the all-time high of $160.20 in April 2008 draws to 125.
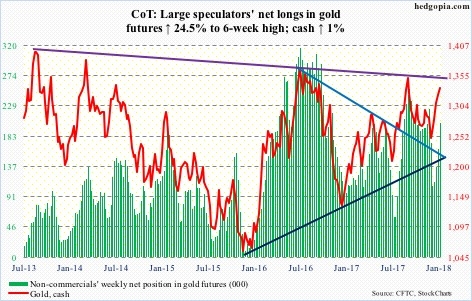
Gold: Currently net long 203.3k, up 40k.
On December 12, the cash ($1,334.90/ounce) bottomed at $1,238.30 and ended the year at $1,309.30. How did the shorts fare during that advance? Got squeezed. Short interest on GLD (NYSE:GLD) (SPDR gold ETF) dropped 31.8 percent p/p to 8.7 million – a 5 1/2-month low.
The metal got one step closer to testing a falling trend line from July 2016, which lies around $1,350. Friday, it broke out of seven-session consolidation.
Leading into this, non-commercials added more to net longs.
Flows were not helping, though. In the week to Wednesday, IAU (iShares gold trust) took in $187 million, but GLD lost $300 million (courtesy of ETF.com).
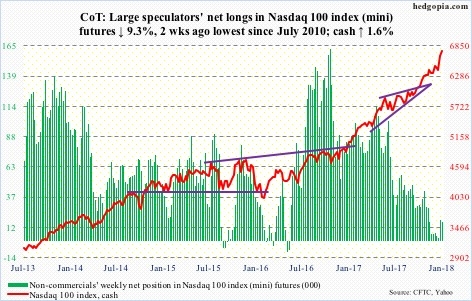
Nasdaq 100 index (mini): Currently net long 16.2k, down 1.7k.
In the December 16-29 period, short interest on QQQ (PowerShares QQQ trust) fell 9.7 percent p/p. On XLK (SPDR technology sector ETF), it dropped 19.3 percent. On the Nasdaq composite, it declined 5.7 percent to 7.8 billion – an 11-month low. You get the picture. Shorts were getting squeezed left and right, and this probably continued this year. The Nasdaq 100 (cash) is already up 5.7 percent year-to-date. This week, it rose 1.6 percent.
Unlike in the prior week, when QQQ lost $2.2 billion, this week it attracted $1.8 billion (courtesy of ETF.com).
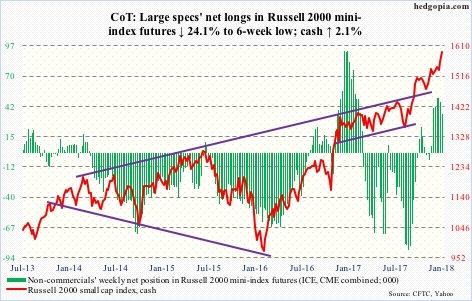
Russell 2000 mini-index: Currently net long 35.5k, down 11.3k.
The cash pretty much went sideways in the second half last month. Yet, short interest on IWM (iShares Russell 2000 ETF) dropped 20.9 percent p/p. Kudos to the shorts. The ETF/Russell 2000 broke out on Thursday – finally.
At least in the week through Wednesday, IWM was still seeing withdrawals – $549 million worth ($5.5 billion in the last five). IJR (iShares core S&P small-cap ETF) lost another $34 million (courtesy of ETF.com).
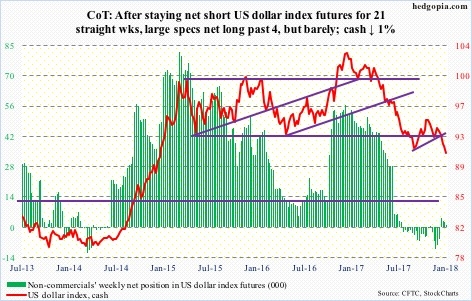
US Dollar Index: Currently net long 826, down 1.3k.
The cash (90.74) Tuesday managed to rally to 92.36, but did not have enough firepower to overcome broken-support-turned-resistance at 92-93. This was further aggravated by central-bank commentaries in the next couple of sessions.
The Bank of Japan Wednesday triggered speculation that it would unwind its massive stimulus, putting upward pressure on the yen. This was followed by the ECB minutes mentioned above, which in turn helped the euro.
Non-commercials continue to remain nonchalant.
The next decent support lies at 89.
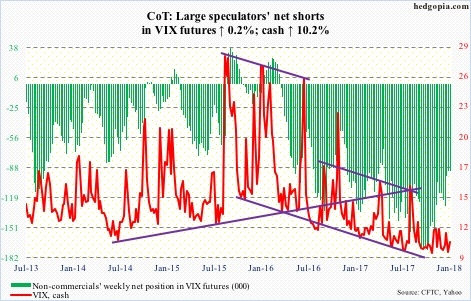
VIX: Currently net short 91.8k, up 223.
Same old, same old!
No sooner did the cash (10.16) tried to rally than it was slapped hard. On Wednesday, VIX rallied intraday to 10.85 but only to reverse at the 200-day to end the session at 9.82.
This is not some recent phenomenon. In each of the 10 months from March through December last year, the monthly candle had a long wick. Volatility suppression has gone on for a while.
This week, though, VIX rallied, as did the S&P 500. This is rare – whatever it means.
In the meantime, the 21-day moving average of the CBOE equity put-to-call ratio dropped to .56 Friday – the lowest since July 2014.
Thanks for reading!

