Russell 2000 Gets Stronger

Published 04/28/2016, 08:31 AM
Updated 05/14/2017, 06:45 AM
US500
-
US2000
-
IWM
-

Tax day started it. That's when I noted that there were Sharks Circling the Russell 2000 chart. The pattern developing at that time looked to give the Russell a lift. Last week the story got even better and I pointed out 5 Positive things in the Russell 2000 chart.

The small-cap index continued higher. By the end of last week it had reached the Potential Reversal Zone (PRZ) of that Shark pattern at 113. With the pause there it looked like maybe that was it. Another lower high after a strong rally. And that still might be the case. The markets were disappointed by the Bank of Japan decision to take no action. The Japanese market lost over 3%. In the US the the S&P 500 has dropped all the way back to Monday levels. Not so bad. And the small caps? They opened near the Tuesday consolidation area at 114 on the Russell 2000 ETF (NYSE:IWM).
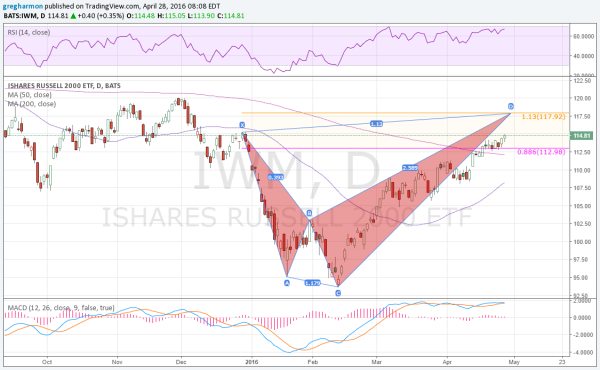
iShares Russell 2000

The small caps are continuing to show strength. And with that comes separation from that PRZ on the Shark pattern. This would mark a failed reversal for other harmonic patterns, but the Shark comes with 2 PRZs. The second one stands above at about 118. And with the continued strength in the RSI and MACD, it looks like a run to that second PRZ is in order. If that occurs, it would make for a higher high -- above the December range -- and place the Russell firmly back in the consolidation levels of last fall.

Latest comments

Loading next article…
Risk Disclosure: Trading in financial instruments and/or cryptocurrencies involves high risks including the risk of losing some, or all, of your investment amount, and may not be suitable for all investors. Prices of cryptocurrencies are extremely volatile and may be affected by external factors such as financial, regulatory or political events. Trading on margin increases the financial risks.
Before deciding to trade in financial instrument or cryptocurrencies you should be fully informed of the risks and costs associated with trading the financial markets, carefully consider your investment objectives, level of experience, and risk appetite, and seek professional advice where needed.
Fusion Media would like to remind you that the data contained in this website is not necessarily real-time nor accurate. The data and prices on the website are not necessarily provided by any market or exchange, but may be provided by market makers, and so prices may not be accurate and may differ from the actual price at any given market, meaning prices are indicative and not appropriate for trading purposes. Fusion Media and any provider of the data contained in this website will not accept liability for any loss or damage as a result of your trading, or your reliance on the information contained within this website.
It is prohibited to use, store, reproduce, display, modify, transmit or distribute the data contained in this website without the explicit prior written permission of Fusion Media and/or the data provider. All intellectual property rights are reserved by the providers and/or the exchange providing the data contained in this website.
Fusion Media may be compensated by the advertisers that appear on the website, based on your interaction with the advertisements or advertisers.
© 2007-2025 - Fusion Media Limited. All Rights Reserved.