The Russell 2000 is used by many as a leading indicator of the market. If it is rising then the broad market will follow. Problem is that the Russell 2000 was the last index left to close its gap down at the start of the year. It did not happen until last week.
I believe this has a lot to do with the negative sentiment, the ‘lighten up here’ attitude that traders are expounding, despite a 2 month trend higher in the markets.
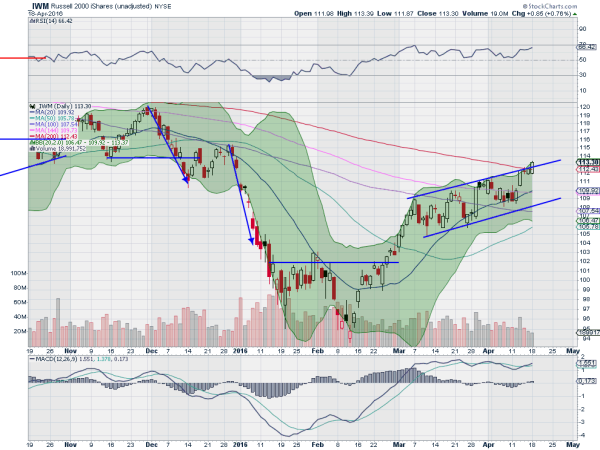
But a closer look at the Russell 200 ETF (NYSE:IWM) chart shows that even while it has been lagging the other indexes there is a lot to be happy about. The first is that 2 month trend higher. And the recent rising channel, at a more sustainable pace, removes much of the ‘Dead Cat Bounce’ risk that the initial steep rise held.

The price action Friday and Monday is another positive. First breaking that channel to the upside and then showing continuation. A third is that this has taken the Russell 2000 over its 200 day SMA, the most basic of bullish/bearish indicators.
Add to that bullish momentum with the RSI in the bull range, strong but not overheating, and a MACD that is positive and crossed up. The SMA’s are turning higher on the shorter timeframes, the 20 and 50 day, and on a trajectory for a possible Golden Cross in the next few weeks.
Yes the Russell 2000 has lagged, but it is sometimes that challenger holding back some strength moving with a steady pace that overtakes the rest on the longer run. Will it happen this time with the Russell 2000?
Disclosure: The information in this blog post represents my own opinions and does not contain a recommendation for any particular security or investment. I or my affiliates may hold positions or other interests in securities mentioned in the Blog, please see my Disclaimer page for my full disclaimer.
