NVDA Q3 Earnings Alert: Why our AI stock picker is still holding Nvidia stockRead More

Sharks Circle Russell 2000

Published 04/15/2016, 09:59 AM
Updated 05/14/2017, 06:45 AM
RTYZ24
-
IWM
-

The Russell 2000 is used by many traders and investors as an indicator of strength of the market and a harbinger of which way it may head. So it should come as no surprise that traders are studying the recent action and are ready to attack.

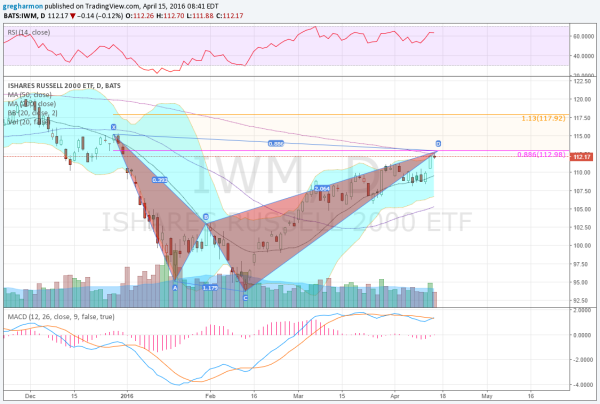
The Russell 2000 (NYSE:IWM) has built a Shark harmonic pattern over the last 3-and-a-half months. The chart below shows the detail. This is a bearish reversal pattern and if price action triggers, expect a move to 113 and then a fall back lower. At that point the pattern would look for a a 38.2% or 61.8% retracement of the full range, which would draw it lower to 107 or even 101.90.

iShares Russell 2000

But the Shark is mysterious and so is the pattern. It actually has 2 Potential Reversal Zones (PRZ), and the second is still well above 118. The momentum indicators suggest that the run higher is not done yet. The RSI is in the bullish zone and the MACD is crossing up and positive. The Bollinger Bands® are also pointing higher. The 200-day SMA just overhead will have many bearish-leaning traders looking to take some profits.

Will it stop and reverse here near 113, or continue to 118? Or something completely different? We will have to watch and see.

Latest comments

Loading next article…
Risk Disclosure: Trading in financial instruments and/or cryptocurrencies involves high risks including the risk of losing some, or all, of your investment amount, and may not be suitable for all investors. Prices of cryptocurrencies are extremely volatile and may be affected by external factors such as financial, regulatory or political events. Trading on margin increases the financial risks.
Before deciding to trade in financial instrument or cryptocurrencies you should be fully informed of the risks and costs associated with trading the financial markets, carefully consider your investment objectives, level of experience, and risk appetite, and seek professional advice where needed.
Fusion Media would like to remind you that the data contained in this website is not necessarily real-time nor accurate. The data and prices on the website are not necessarily provided by any market or exchange, but may be provided by market makers, and so prices may not be accurate and may differ from the actual price at any given market, meaning prices are indicative and not appropriate for trading purposes. Fusion Media and any provider of the data contained in this website will not accept liability for any loss or damage as a result of your trading, or your reliance on the information contained within this website.
It is prohibited to use, store, reproduce, display, modify, transmit or distribute the data contained in this website without the explicit prior written permission of Fusion Media and/or the data provider. All intellectual property rights are reserved by the providers and/or the exchange providing the data contained in this website.
Fusion Media may be compensated by the advertisers that appear on the website, based on your interaction with the advertisements or advertisers.
© 2007-2024 - Fusion Media Limited. All Rights Reserved.