With the June Fed meeting on deck next week, the S&P 500 (SPX) is making another attempt at taking out the secondary highs from early March and recapturing some of the upside momentum lost this year. Although higher beta equity indexes like the Russell 2000 and NASDAQ Composite have already made successively higher highs, we primarily focus on the S&P 500 as it is the most widespread followed and broad based measure for US stocks.
From our perspective – and despite the SPX trading only a percentage point off the intraday highs from early March, we believe downside risks over both the near and intermediate-term still far outweigh the potential upside and maintain the view that the parabolic breakdown that began in January should be patiently respected.
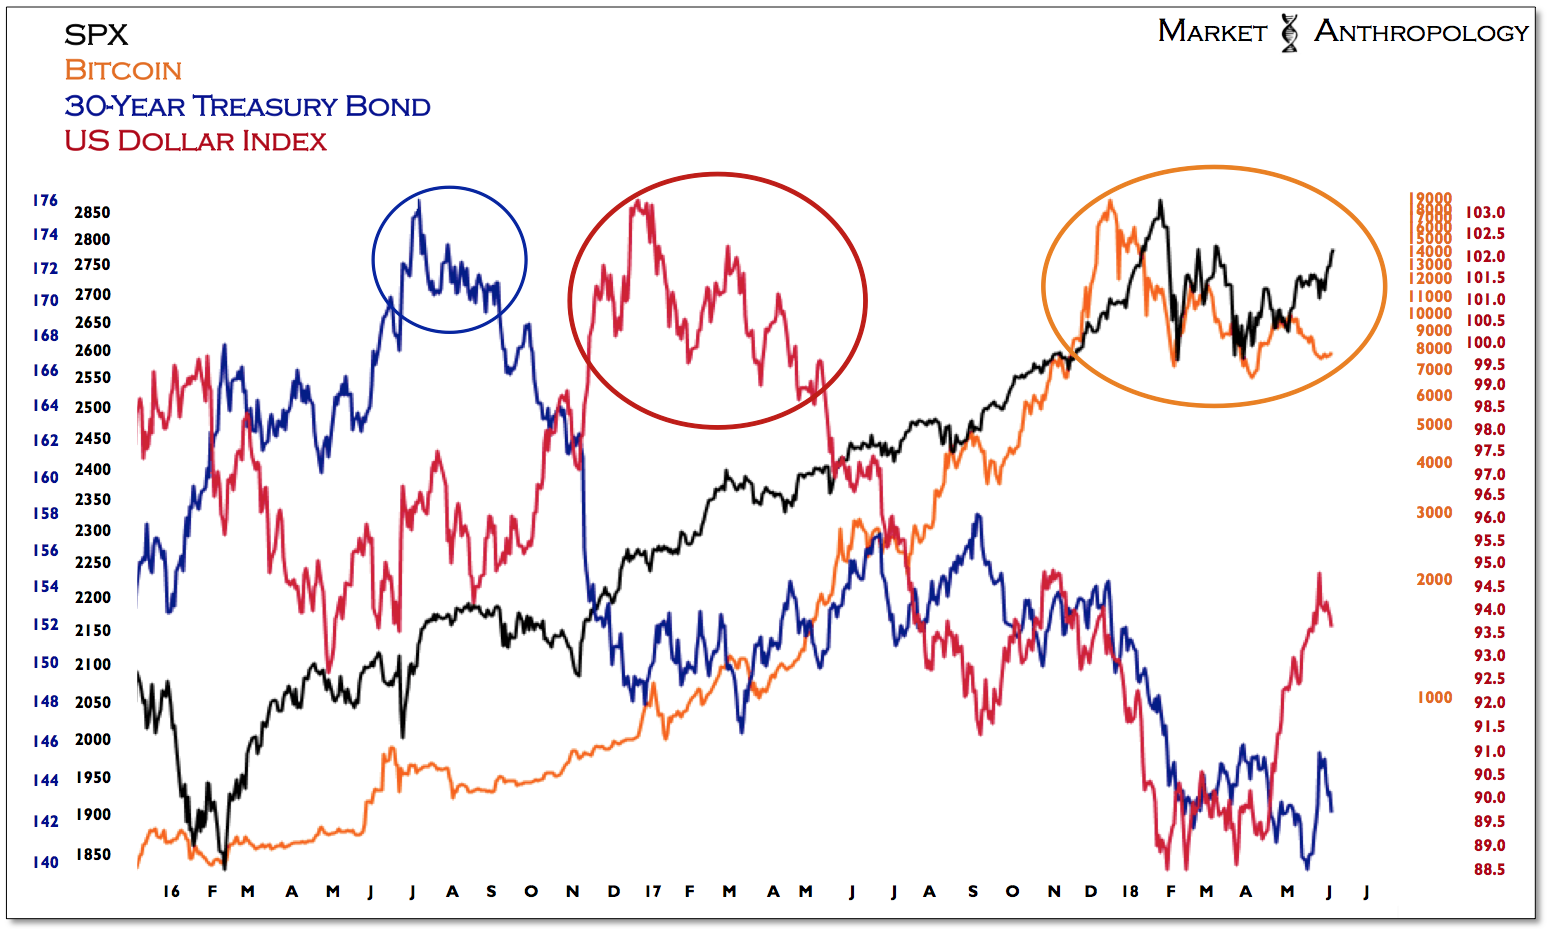
As we highlighted in our last note, we are following the previous breakdowns in long-term Treasuries (2016) and the US dollar index (2017) as a potential leading and successive pattern that is now playing out in equities. Should the pattern continue to replicate, stocks would again be rejected below previous highs, eventually manifesting with a breakdown leg below previous support from April and February of this year.
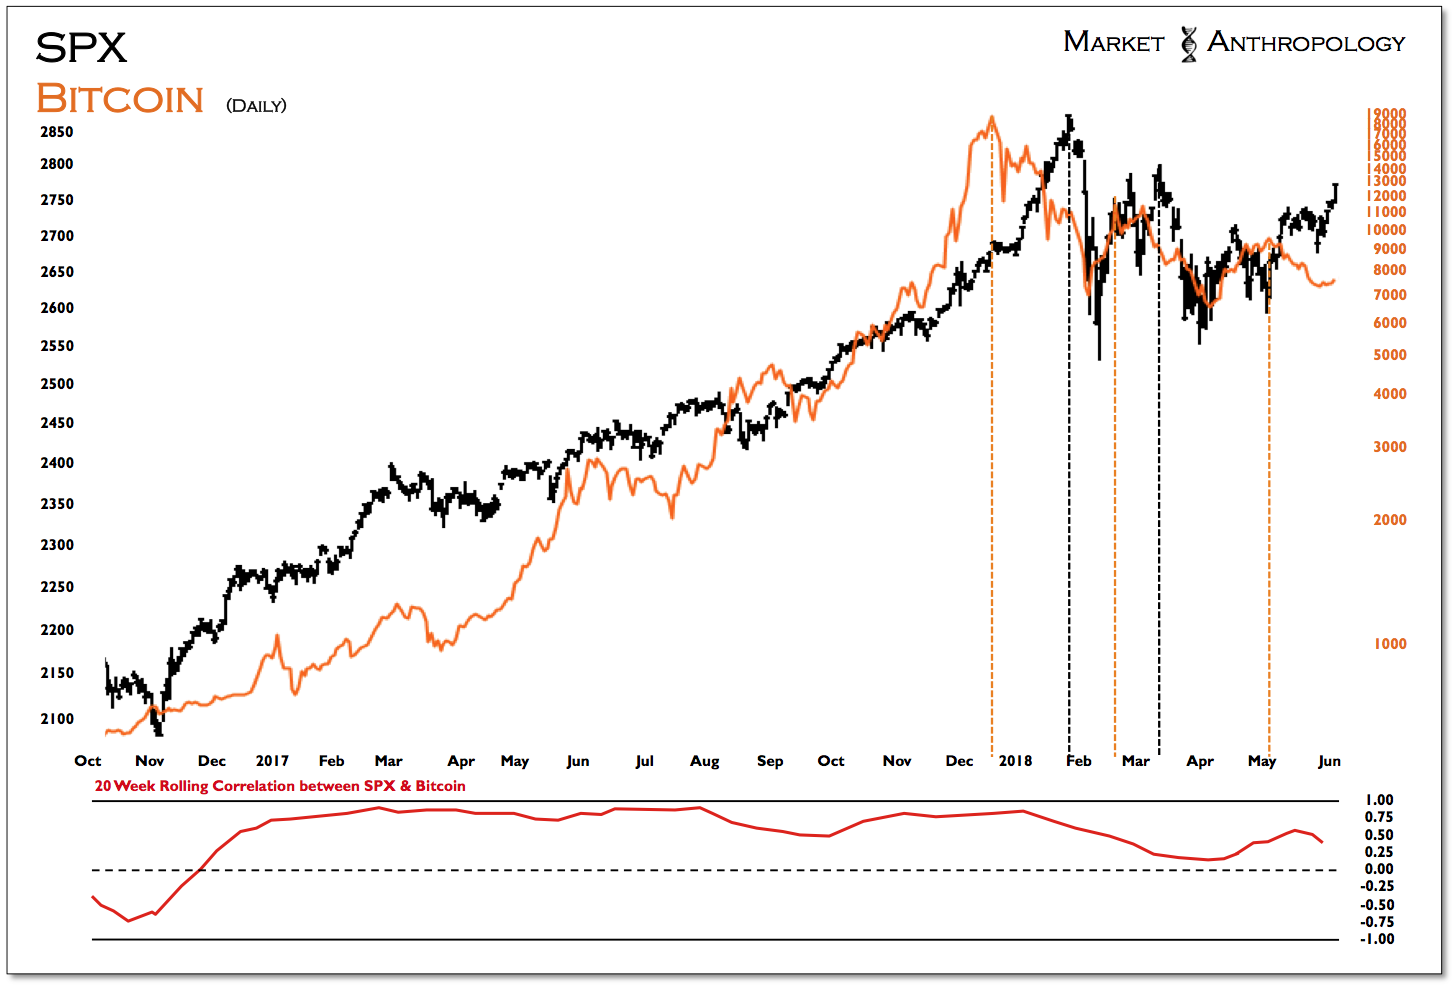
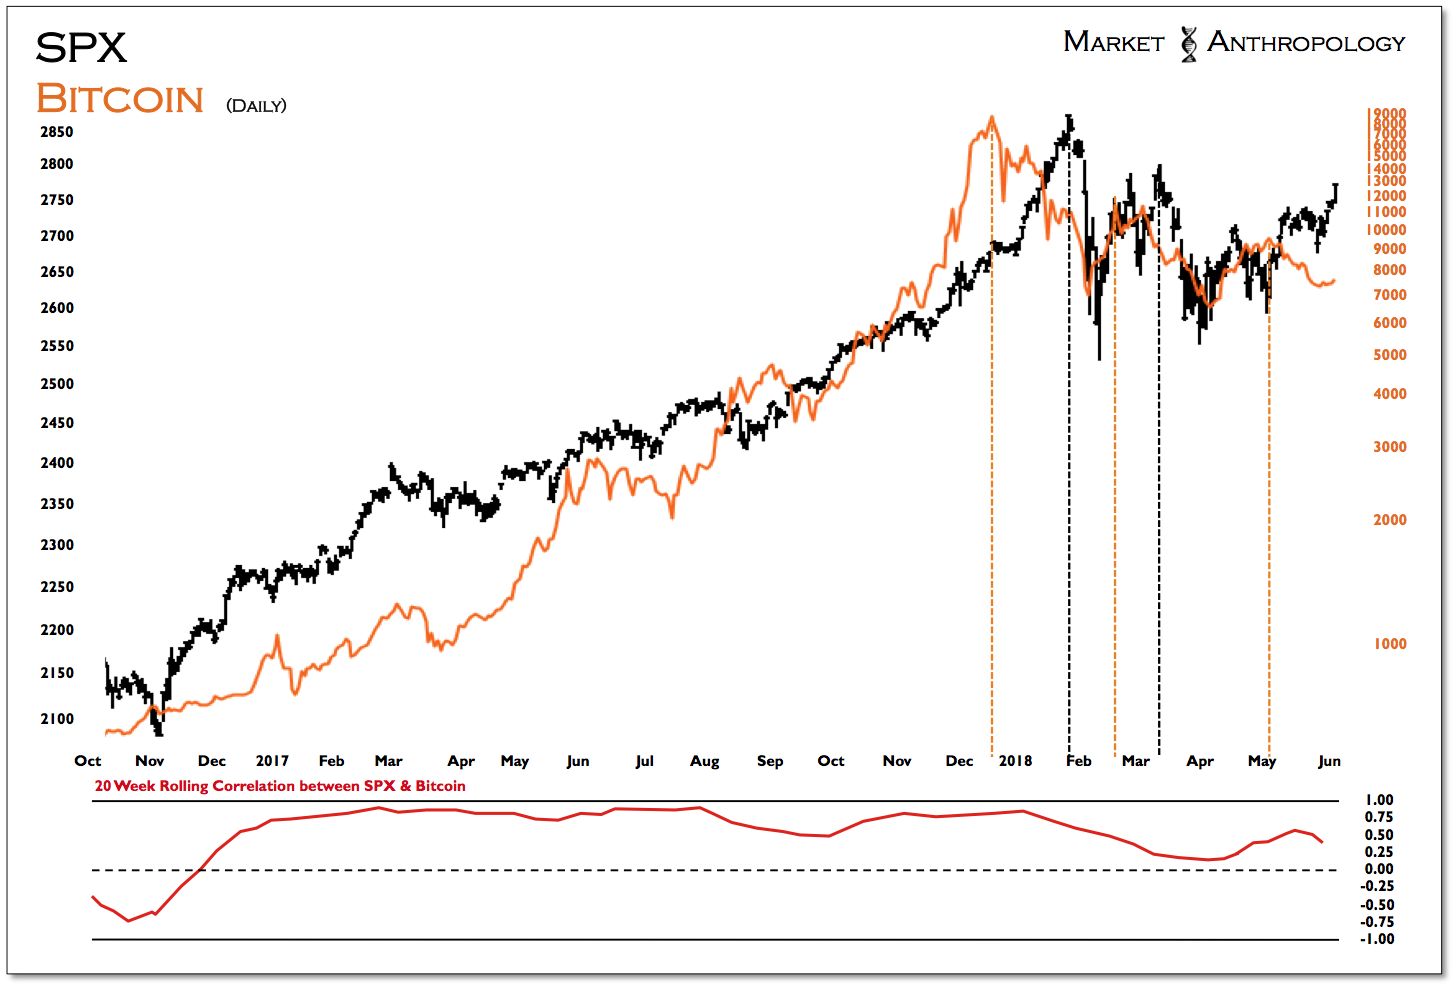
Moreover, in the current cycle for risky assets, highly speculative cryptocurrencies like Bitcoin have led the two previous reversals in the S&P 500 this year by several weeks. With Bitcoin rolling over in early May below its previous secondary highs, it now appears poised to challenge downside support below 7000.
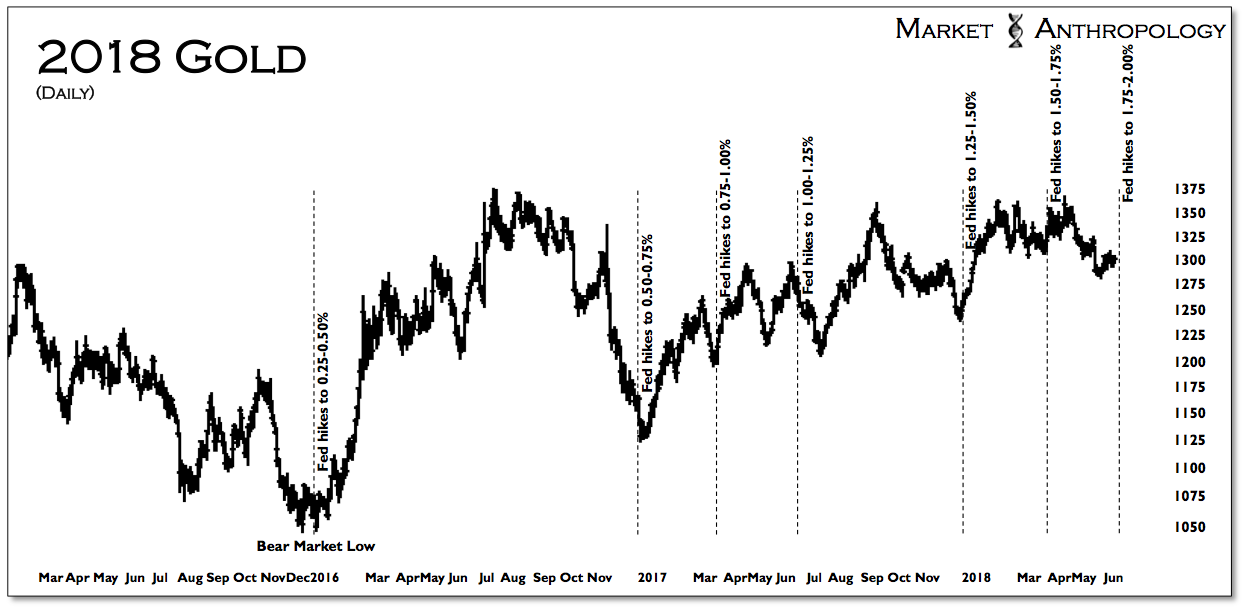
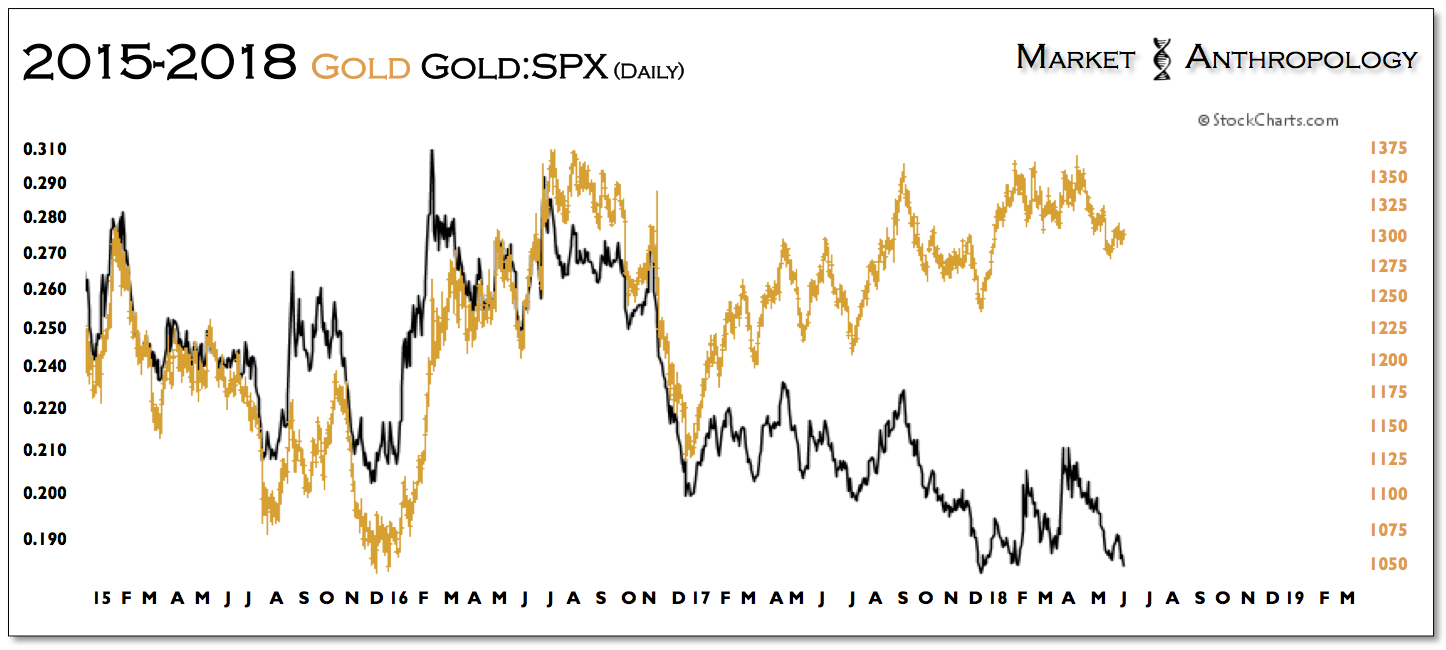
Coming into the Fed meeting next week, gold appears set to again follow the more typical trading pattern of rallying subsequent to the Fed decision, by again challenging the previous cycle highs around 1370.
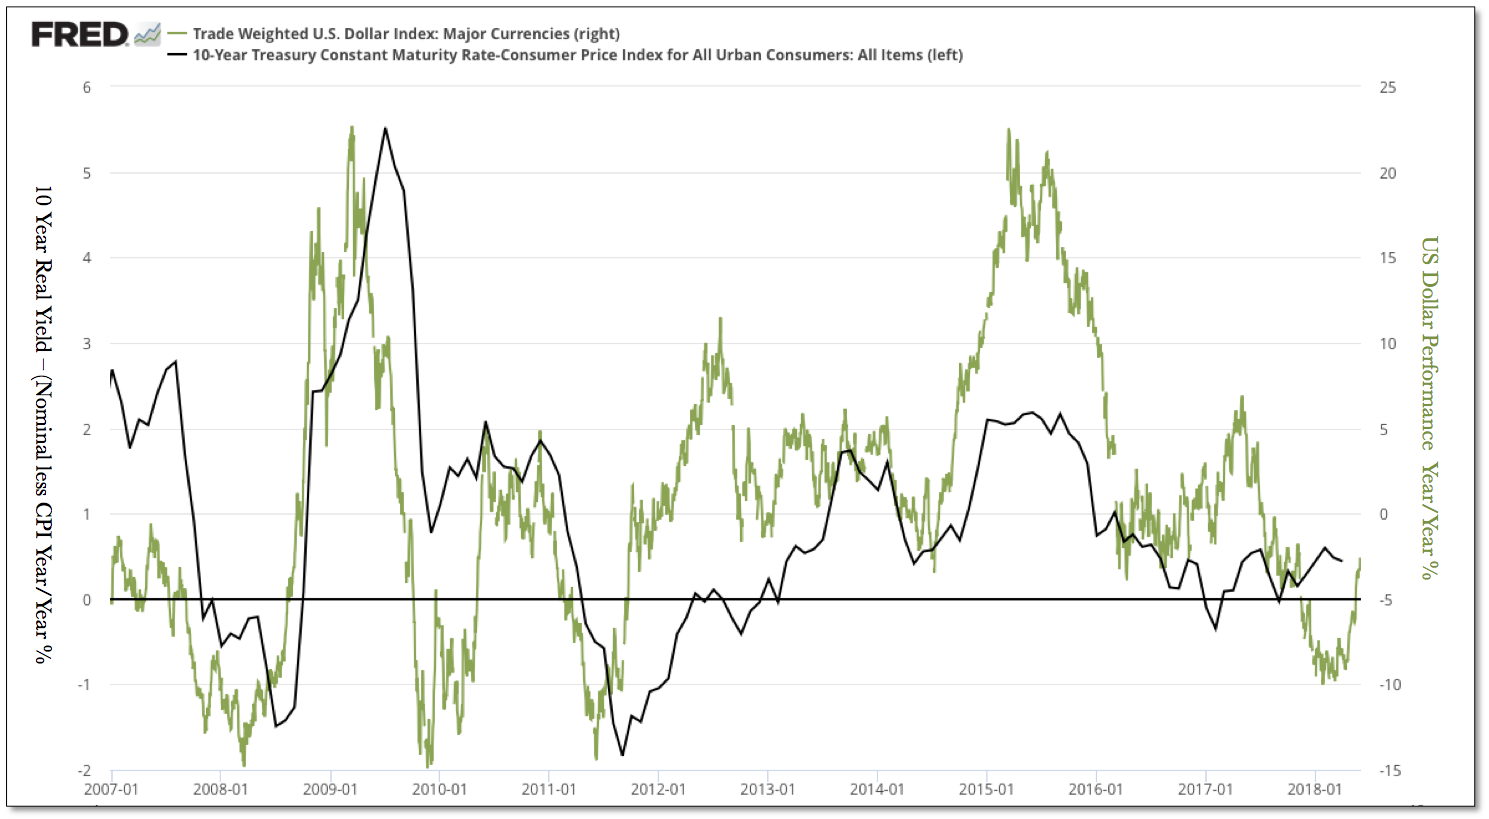
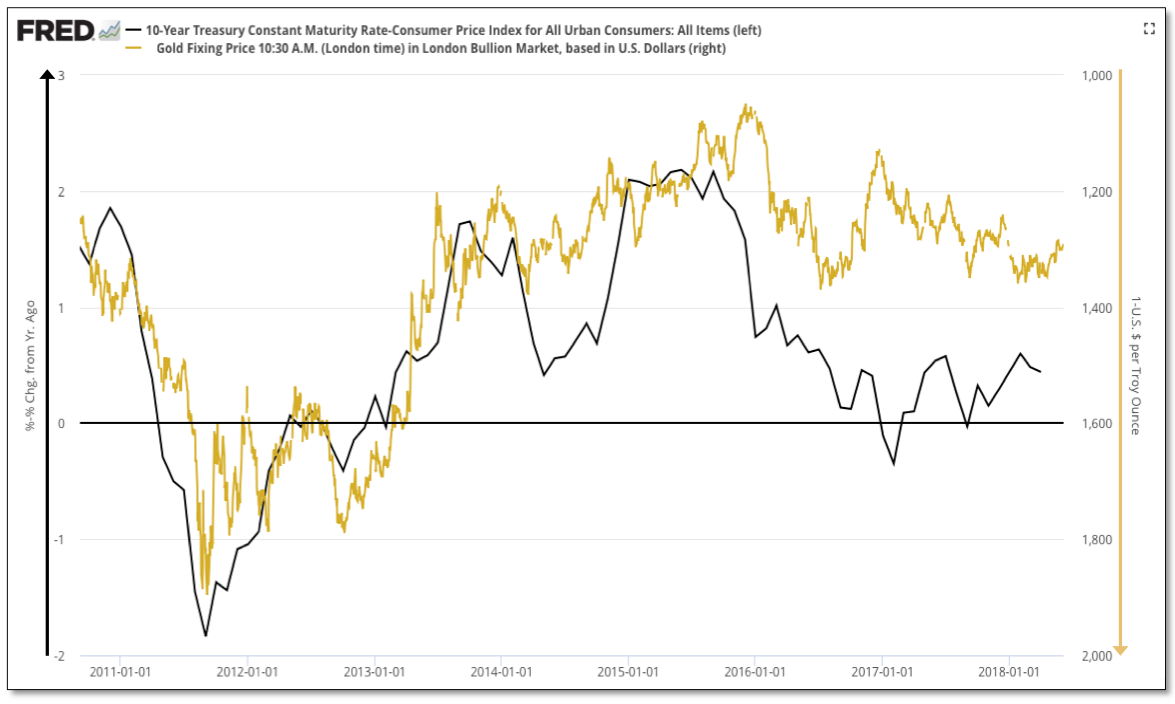
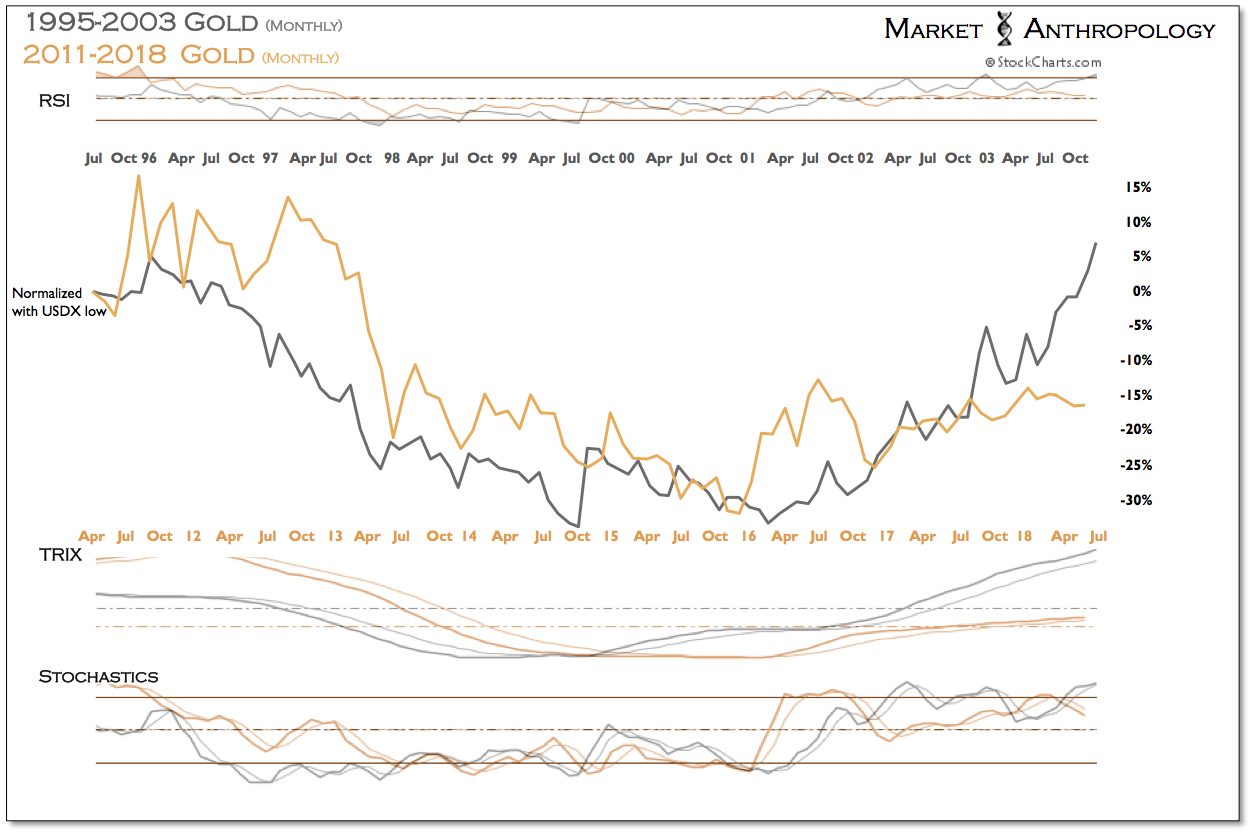
Although we expect gold on a relative performance basis to outperform equities over both an intermediate and long-term timeframe, we increasingly have become less confident this year that gold itself will have the beneficial macro backdrop of declining real yields and a staunchly weaker dollar to materially breakout above its previous highs. While the upcoming inflation reports for last month may still be supported by the weak performance of the dollar through Q1, the now synchronized global slowdown and recent rally in the dollar should manifest with weaker inflation data later this year.
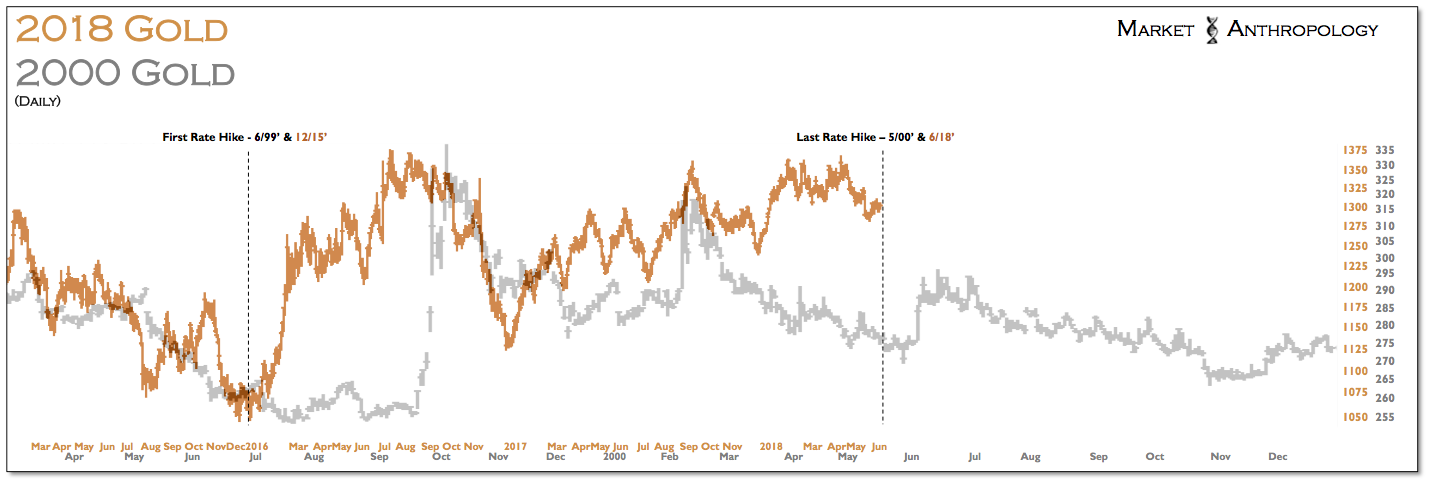
All things considered – and as we described in our two previous notes, although it wouldn't surprise us to see a new cycle high for gold in the coming weeks, we are more inclined to hedge long-term positions rather than capture a potential breakout. We would reassess this defensive posture with a weekly close above 1400.
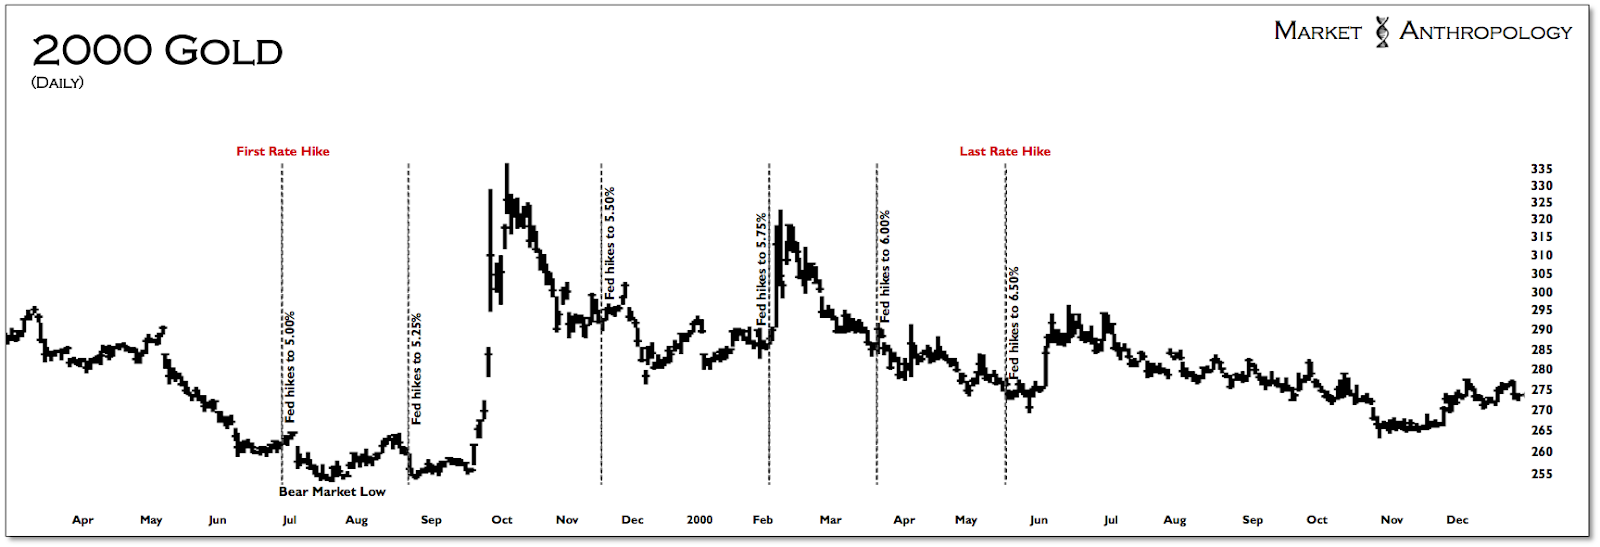
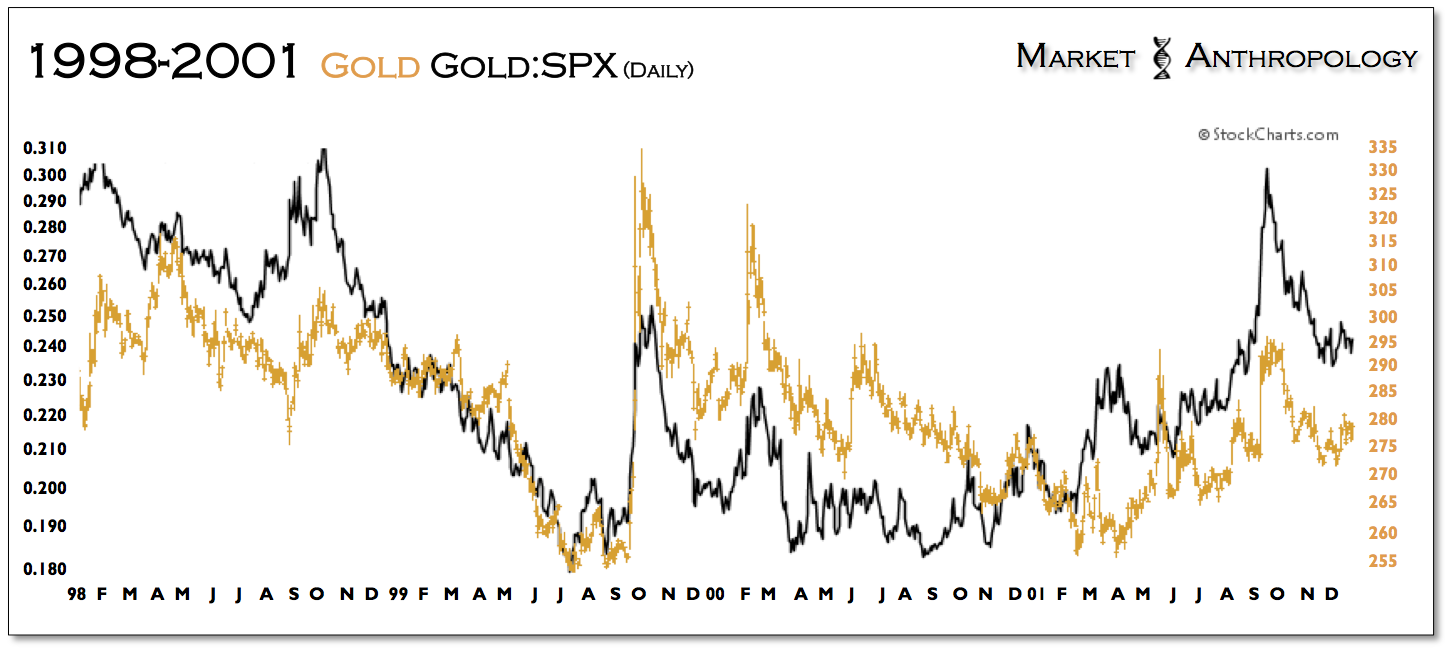
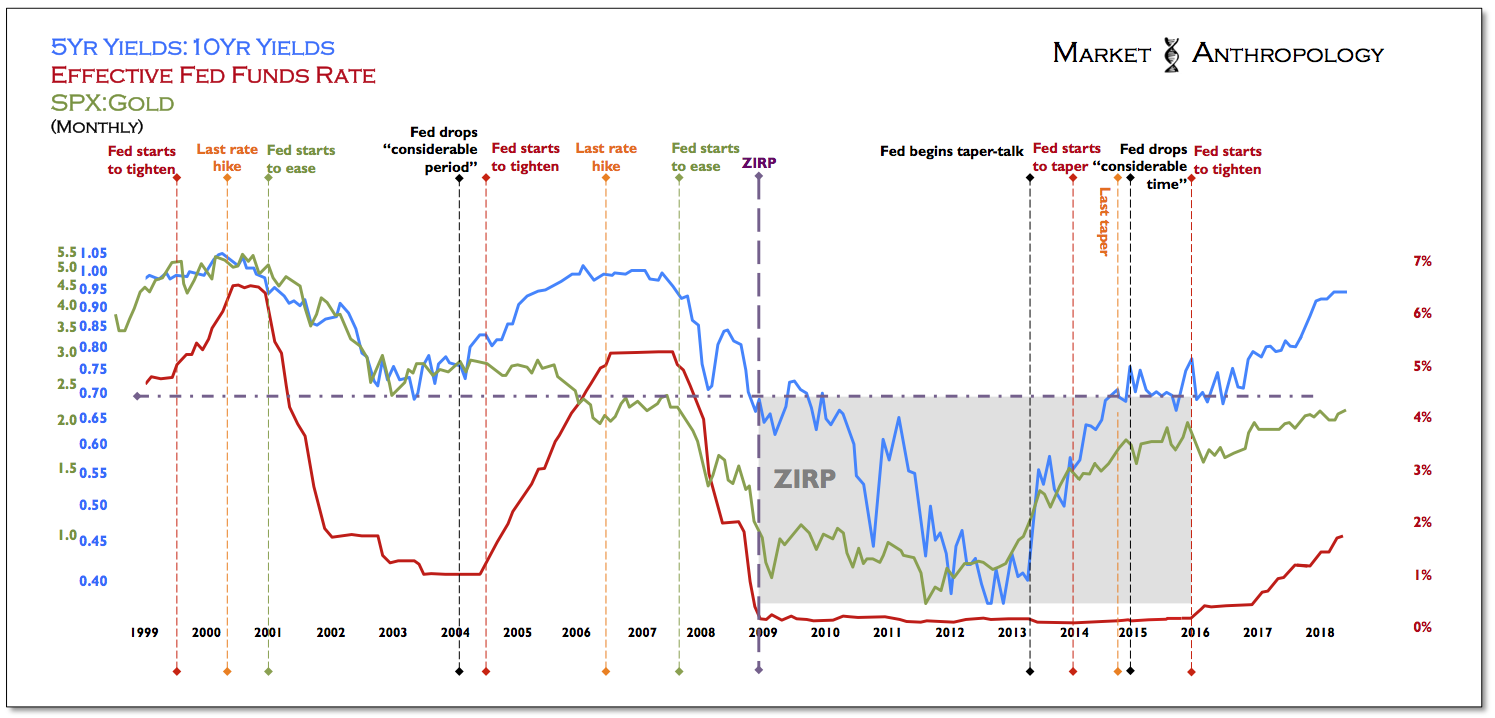
What we may be looking at is a market environment somewhat similar to the back half of 2000, where subsequent to the final Fed rate hike that cycle, gold rallied for a few weeks – before turning down with stocks later that summer. It was only after stocks were rejected in August below the previous highs from March that gold on a relative performance basis began to outperform.
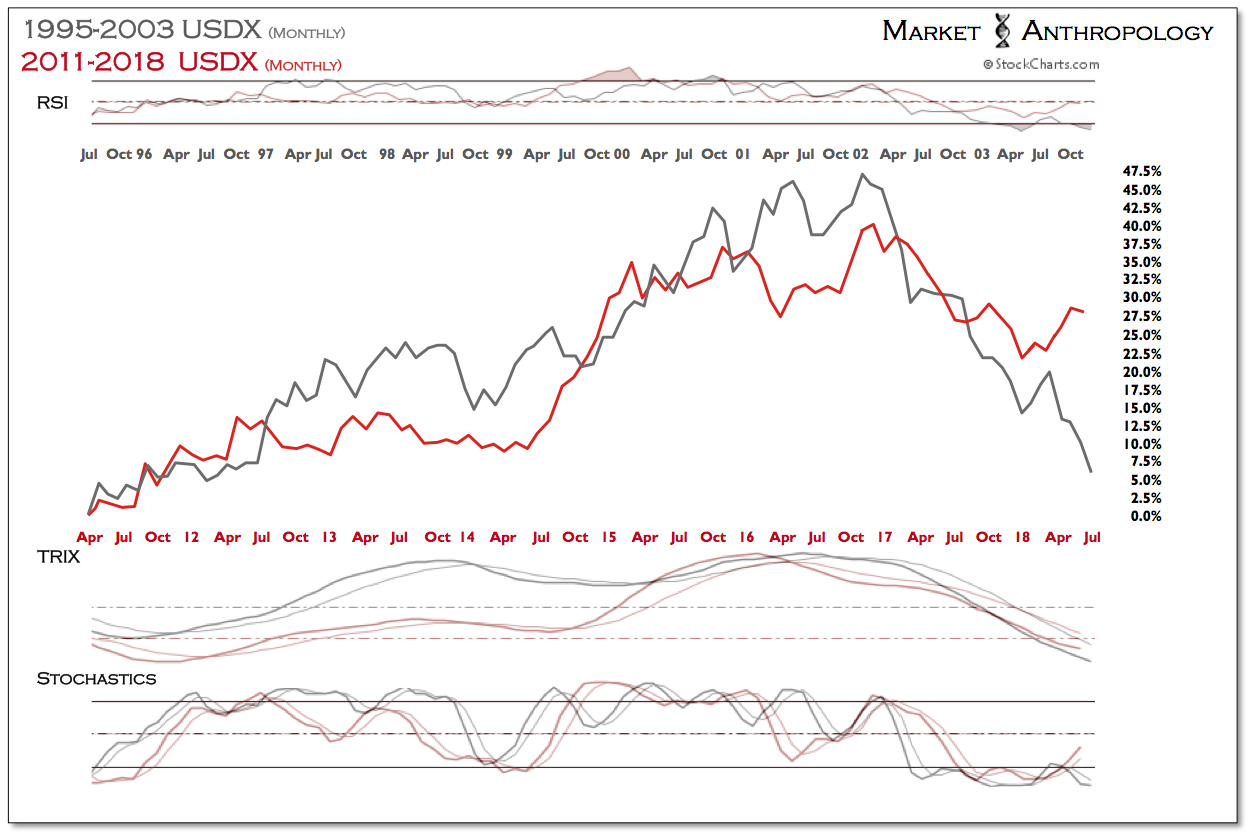
Naturally, the performance of the US dollar is a significant contributing factor towards the direction of real yields and hard assets like gold and commodities. While we don't expect to see new cycle highs for the US dollar index, the divergence in the comparative performance with the previous cycle (2003) appears more likely to persist.
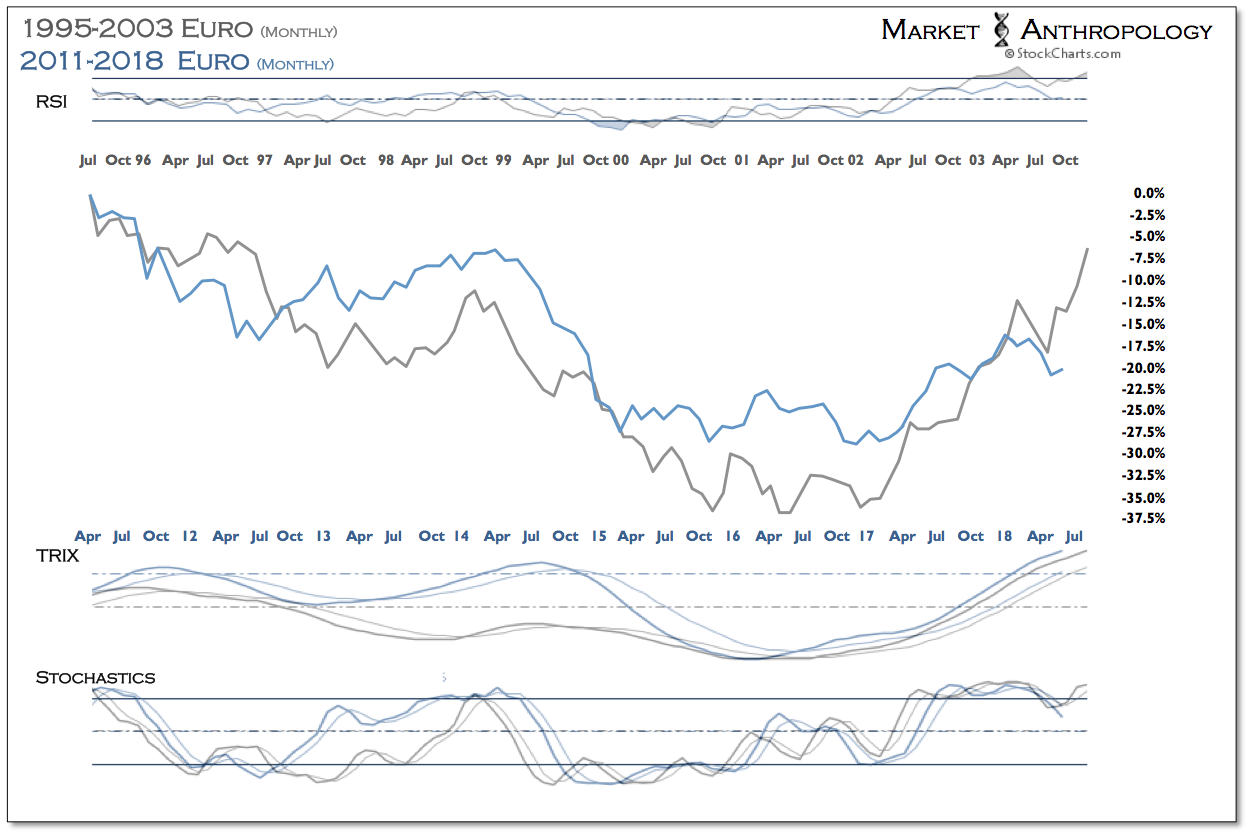
Moreover, should the recent political convulsions in Italy and Spain continue to disrupt European stability – or if markets see further deterioration in european growth this year – support for the euro from the ECB's telegraphed intentions on winding down it's nearly $3 trillion quantitative easing program later this year would evaporate quickly. That said, with the ECB also convening their June meeting next Thursday, we would expect Draghi to shun any proactive dovish leanings and don a cool placid tie and his best face of confidence in maintaining the ECB's conviction in winding down the bond buying program sooner than later. Over the near-term this should support the euro and pressure the dollar index – creating a tailwind for gold as well.
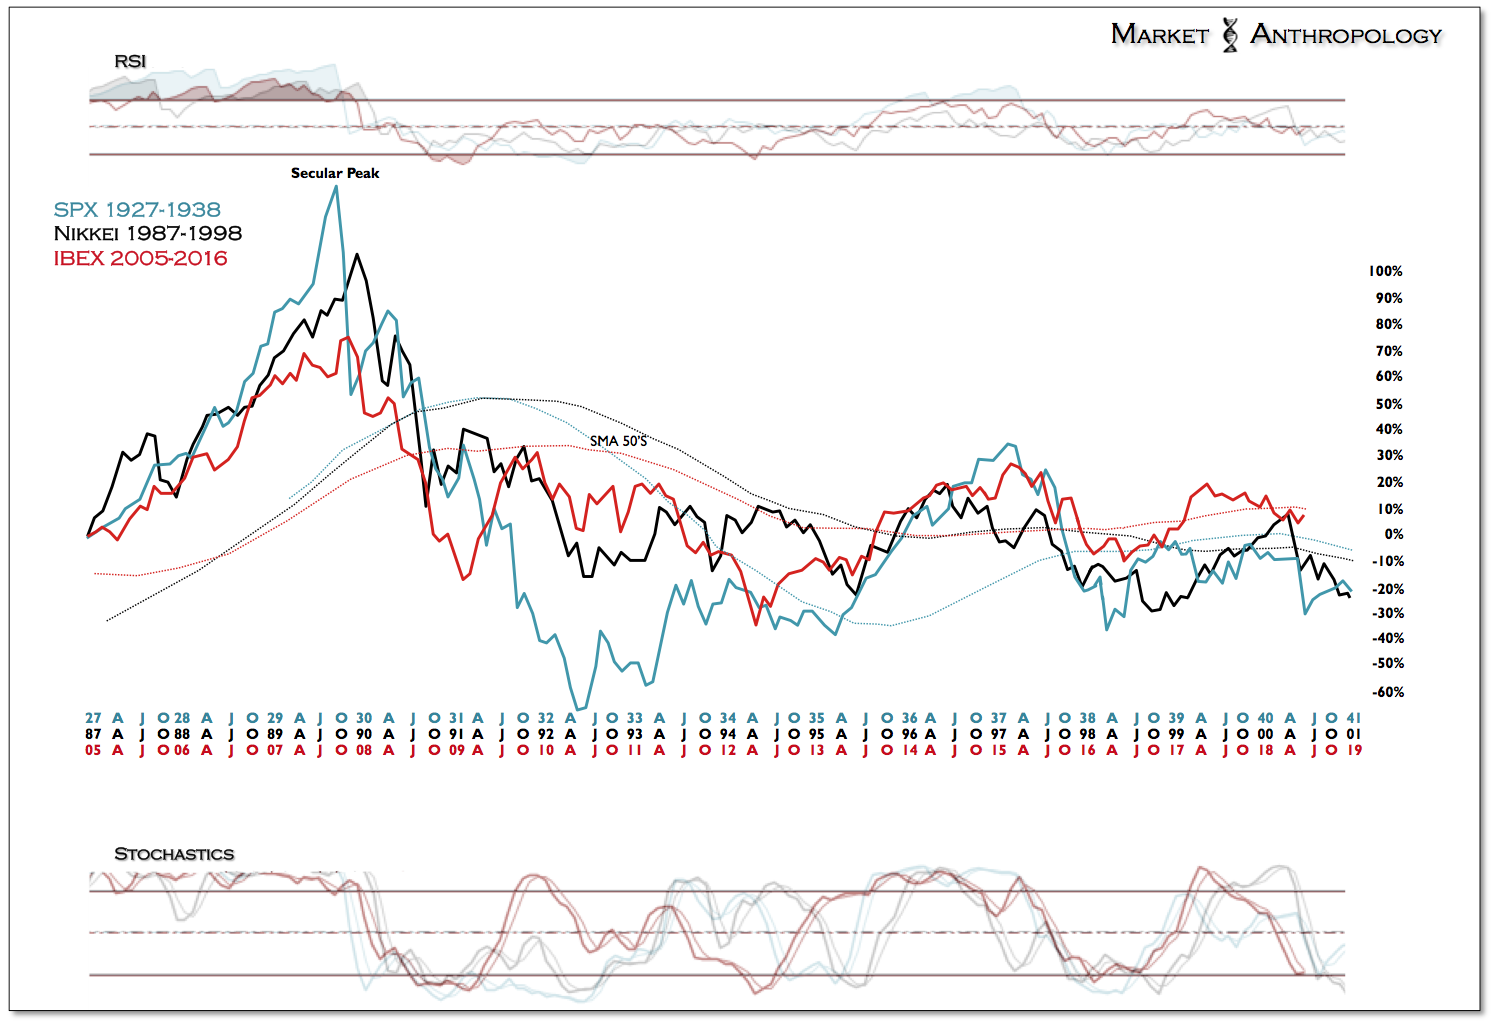
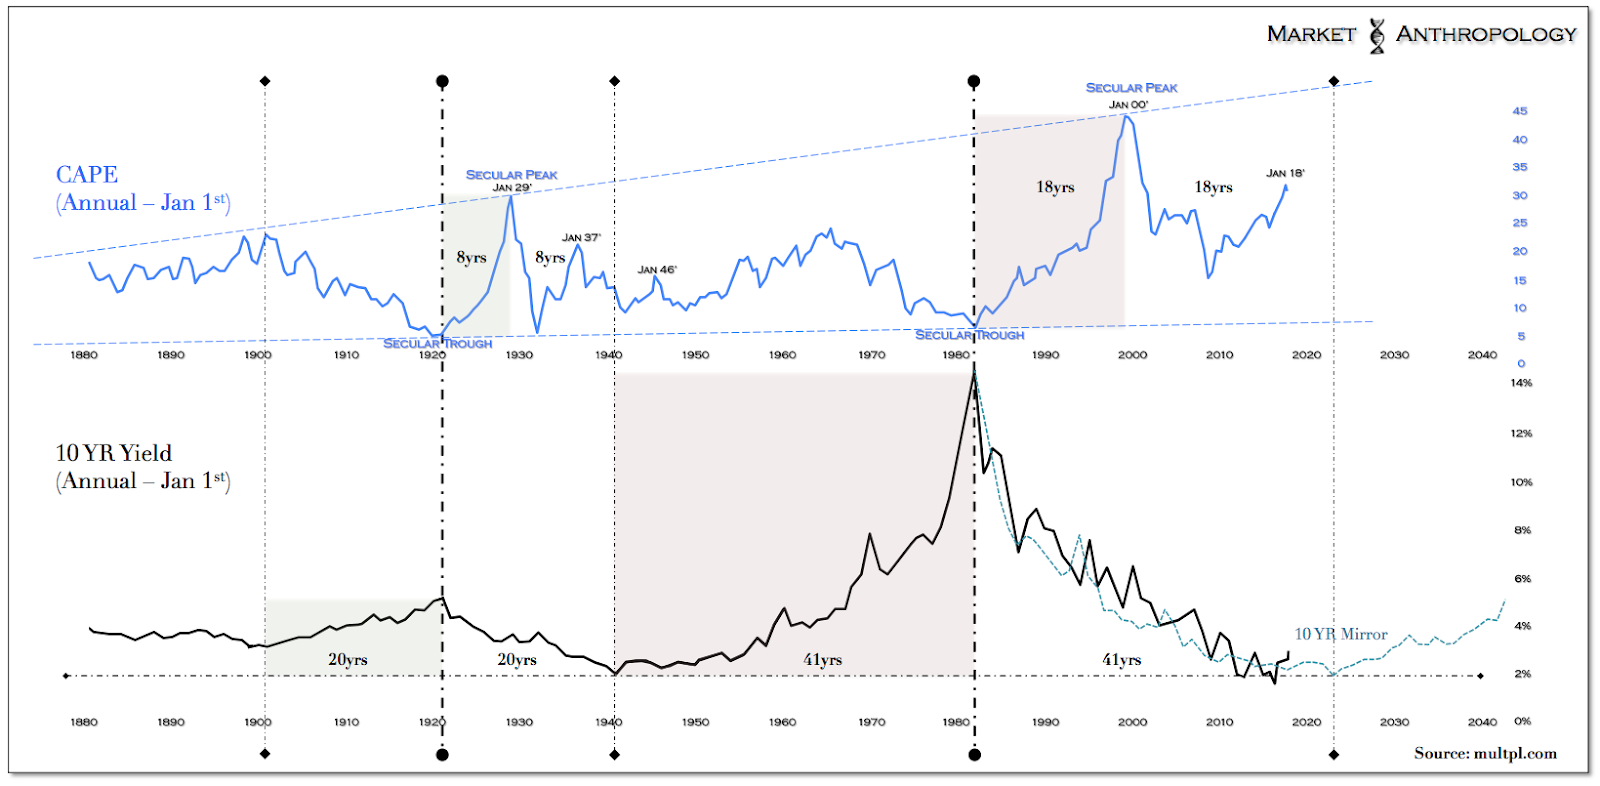
From a wider perspective we continue to follow Spain's IBEX 35 as our higher beta and leading proxy for Europe. The long-term comparative performance chart that we've highlighted of the IBEX over the past five years has continued to loosely track two of the largest and longest perennial asset unwinds of the previous century.
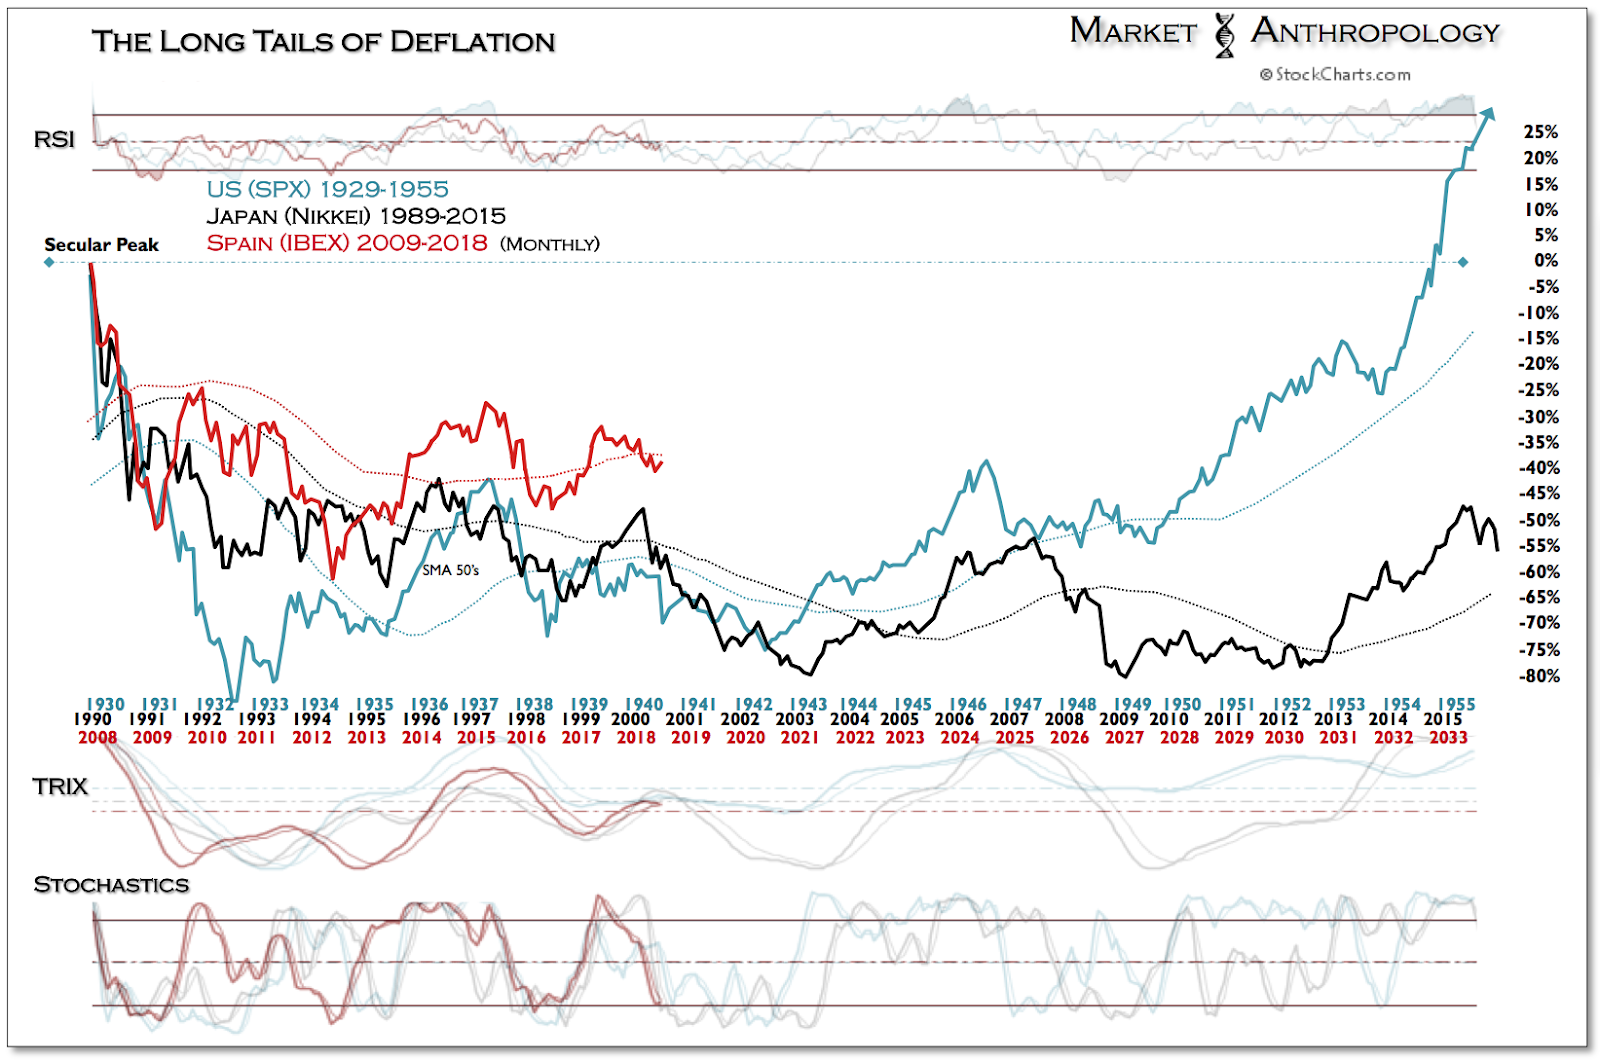
Should the comparative continue to prove prescient, the downturn in Spain's IBEX – that led the broader reversals in European equities this year, has considerable road to travel on the downside over the next two years. In this respect, we'd speculate it would naturally become progressively more challenging for Draghi and the ECB to find the same relative strength across a diverse European economy and within a disparate political system, then what the Fed encountered in their own tightening cycle over the past few years.
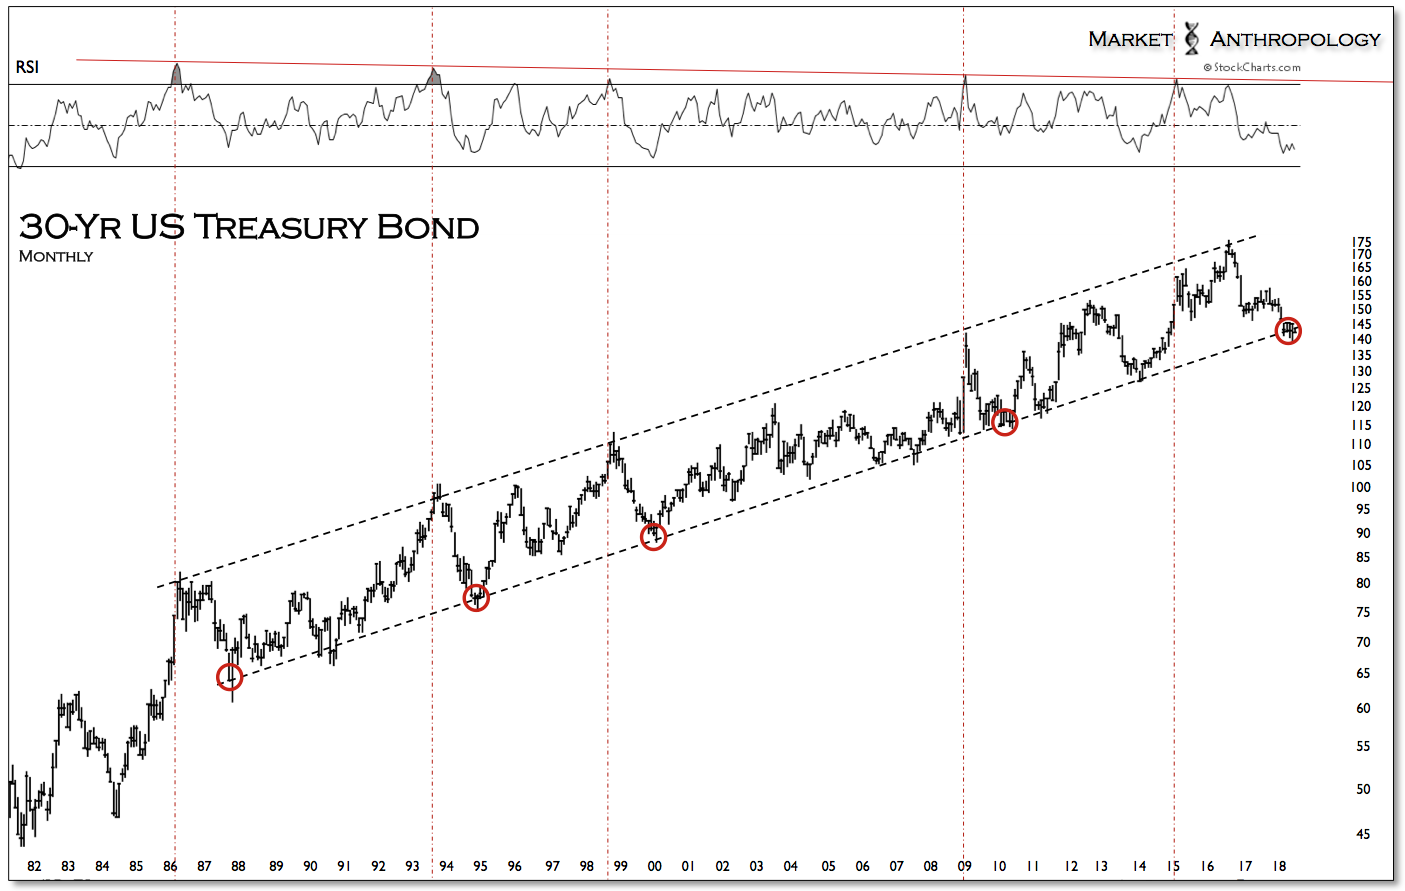
Consequently – and despite what the conventional wisdom is again predicting with a continuation of higher rates, Treasuries continue to look robustly appealing from a near and intermediate-term timeframe – as well as from a fundamental, technical and behavioral point-of-view.
