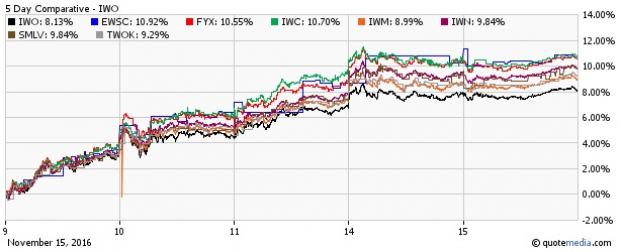
U.S. stock markets are in great shape since Trump won the election, with some of the key indexes logging smart gains. The Dow logged its biggest weekly gain in almost five years. The S&P 500-based ETF (AX:SPY) and the Dow Jones Industrial Average ETF (V:DIA) added about 2% and over 3.2% respectively in the last five trading sessions (as of November 15, 2016,).
But the real enthusiasm was noticed in small-caps which saw massive gains. iShares Russell 2000 IWM moved about 9% higher in the past five trading sessions. Let’s take a look at what made these point-sized ETFs mammoth winners (read: ETF Asset Flow in Election Week).
‘America First’ Rhetoric
Trump’s ‘America First’ slogan did a lot to boost small-cap stocks and the related ETFs. Further, hopes of increased fiscal spending, a lenient regulatory environment and lower taxes did the trick. Market watchers benevolently bet on higher growth and an inflationary outlook, though the outcome is yet to be seen.
Normally, smaller companies pick up faster than the larger ones in a growing economy. Since these pint-sized securities usually focus more on the domestic market, they are less ruffled by international worries than their globally exposed larger counterparts and are the biggest beneficiaries of a growing domestic economy.
Greenback Rally
The U.S. dollar received a fresh lifeline with Trump’s win in the presidential election. The currency has been downbeat this year on not-so-robust U.S. economic growth and low interest rates prevailing in the country (read: The Trump Effect: 8 Must-See ETF Charts).
However, a pledge for more domestic job creation and an inflationary outlook took the greenback to a one-year high on November 14. As small-cap stocks are less exposed to foreign markets, these are less scathed by a stronger greenback. Moreover, if by chance, the Fed acts in December, the greenback will gain considerable strength. Such an economic landscape set the stage for small-cap U.S. stocks (read: Currency ETFs in Focus on Strengthening Dollar).
U.S. Economic Growth at Two-Year Best
Trump or not, the U.S. economy is in great shape in any case. In Q3, the economy logged a 2.9% annualized growth rate, after a 1.4% rise the previous quarter and beating the forecast of 2.6% growth. Several economic readings came in favorable. To add to this, “the U.S. is expected to lead global growth higher over the next two years despite the growing threat posed by protectionist policies” as per Moody’s Investors Service. A steadily improving U.S. economy would be the best for small-cap stocks and ETFs.
Election Year Great for Small-Caps?
The below-mentioned chart (as per FTSE Russell) shows the “US Market Performance in Presidential Election Years Since 1980.” FTSE Russell shows the performance of large-caps via the Russell 1000 Index and the performance of U.S. small caps via the Russell 2000 Index. The table shows that the performance of small-caps has been quite assuring in the presidential year (see all small cap ETFs here).

Sam Stovall, U.S. equity strategist at S&P Capital IQ also noted previously that the S&P 500, excluding dividends, rose 6.1% on average in the last year of the presidential election cycle while small-caps, barring dividends, gained about 10.9% on average.
Why Blend?
While a certain level of risk-on sentiment will remain in the marketplace for investors to cash in on the Trump rally, volatility may also flare up. After all, the fear of Fed hike and uncertainties in policies would definitely make some investors anxious.
The small-cap blend equities ETFs space thus comes across as a prudent choice as it bridges the gap between high-flying glamorous growth stocks (measure of risk-on sentiments) and defensive value stocks (perform better in a subdued market). The blend investing style is actually a mix of both growth and value.
And what could be better than picking small-cap blend ETFs with a lower P/E ratio or in other words pouring money into blend ETFs with cheap valuation. As of now, IWM, the largest small-cap blend ETF, has a P/E (ttm) of 19.05 times. Below we highlight five small-cap blend ETFs (as pet etfdb.com) with P/E ratios lesser than IWM.
First Trust Small Cap Core AlphaDEX ETF FYX – P/E 19 times
SPDR Russell 2000 Low Volatility ETF SMLV – P/E 18.84 times
Guggenheim S&P SmallCap 600 Equal Weight ETF EWSC – P/E 18.69 times
SPDR Russell 2000 ETF TWOK – P/E 17.83 times
iShares Micro-Cap IWC – P/E 15.54 times

Want key ETF info delivered straight to your inbox?
Zacks’ free Fund Newsletter will brief you on top news and analysis, as well as top-performing ETFs, each week. Get it free >>
SPDR-DJ IND AVG (DIA): ETF Research Reports
SPDR-SP 500 TR (SPY (NYSE:SPY)): ETF Research Reports
ISHARS-R 2000 (IWM): ETF Research Reports
SPDR-R2000 LV (SMLV): ETF Research Reports
GUGG-SP600 EW (EWSC): ETF Research Reports
ISHARS-RS MCRO (IWC): ETF Research Reports
SPDR-R2000 (TWOK): ETF Research Reports
FT-SC VALUE (FYX): ETF Research Reports
Original post
Zacks Investment Research
